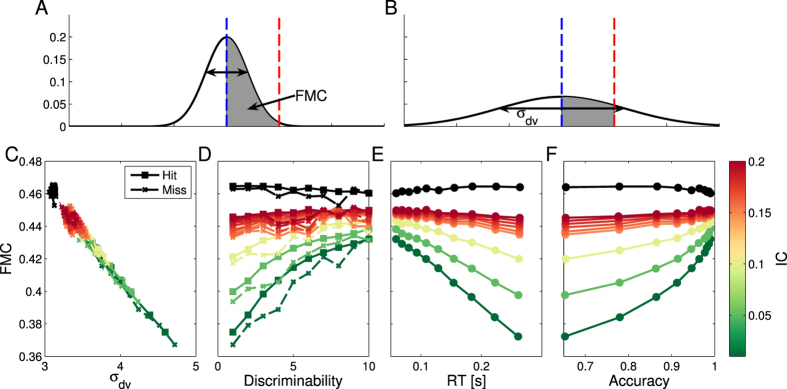
Figure 3.
(A,B) Schematic of the relation between the fraction of modules in the counter range, FMC, and σdv. The counter range is placed between λ and  . When an option is selected, the median firing rate is equal to λ and the FMC is inversely related to σdv. (C) measures the relation between average σdv and average FMC for different discriminabilities and several IC values. The different IC values are represented with different colors as shown in the lateral color bar. The black data points are for
  . (D–F) show FMC as a function of stimuli discriminability, average RT and accuracy. It is clear that average FMC is inversely correlated to σdv, hence for small IC’s FMC is correlated with discriminability, RT and accuracy. However, the inverse relation with σdv associates large FMC to high confidence and small FMC to low confidence.

