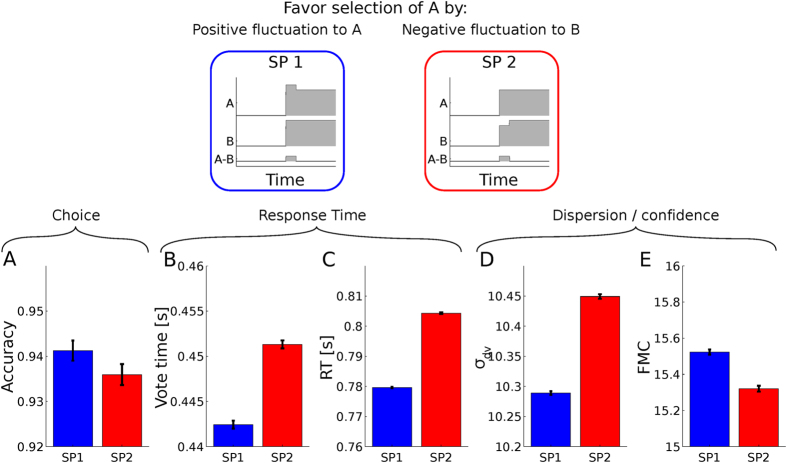
Figure 4. Asymmetric influence of sensory fluctuations to the model’s decision output.
The top panels schematically show the two stimulation protocols (SP 1 and SP 2). SP 1 has a brief positive fluctuation in favor of (A), SP 2 has the a fluctuation of opposite sign and equal strength against (B). (A) Shows the network’s accuracy for both SPs. (B) shows a single module’s mean vote time under the both SPs. (C–E) show the network’s average RT, σdv and FMC under both SPs.

