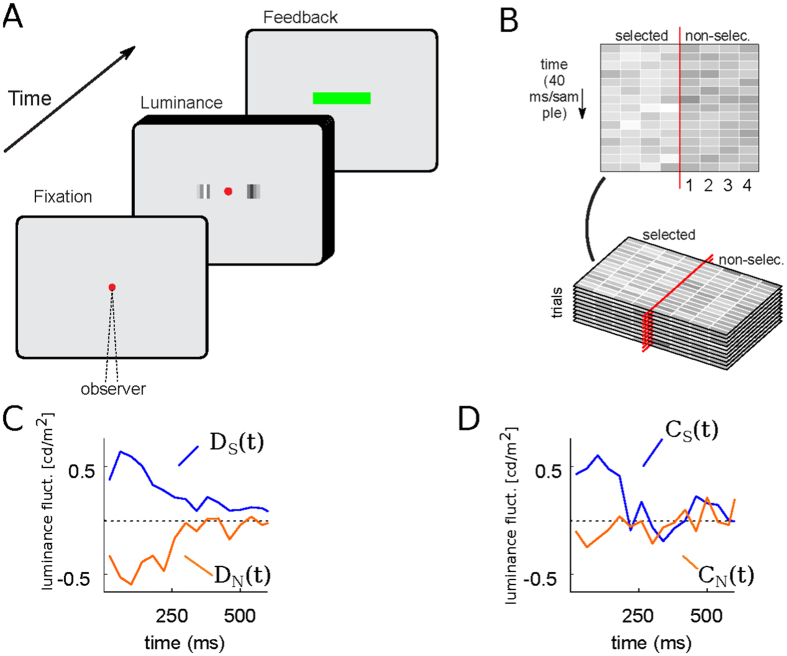
Figure 5.
(A) A trial of the luminance task. Two patches of flickering bars (updated at 25 Hz) were presented until participants made a response. Participants indicated which patch is brighter and the confidence in their decision with a single manual response. (B) Spatiotemporal profile of the luminance signal. The red vertical line represents the fixation point, and the four columns to each side indicate the luminance in time of the four bars in each patch, numbered from the fovea to the periphery. (C,D) show the subject’s decision and confidence kernels respectively.

