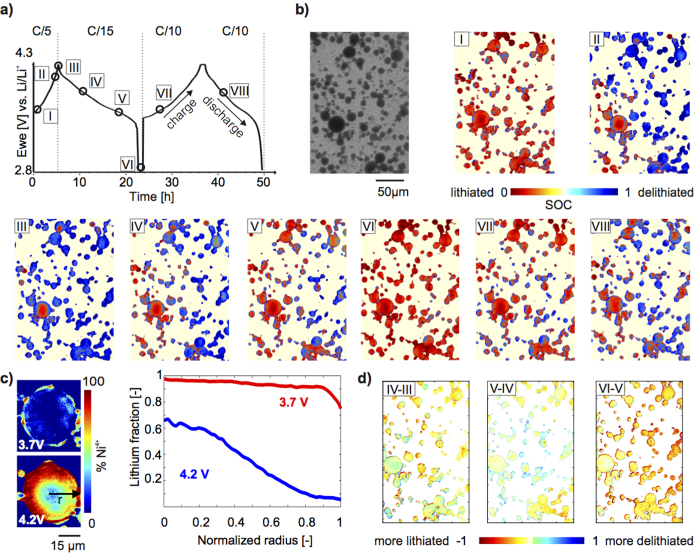
Figure 4. State of charge (SOC) mapping during electrochemical cycling.
(a) Electrochemical cycling profile. (b) Transmission image of a region of electrode for which SOC maps for points I–VIII during the electrochemical cycle shown in panel (a). False colour indicates extent of lithiation (red) or delithiation (blue). (c) Left: Ni4+ oxidation maps of a single large particle during charge at 3.7 V and 4.2 V (times steps I and II in panel (a). A ring-like delithiation pattern is already visible at 3.7 V. Right: Radially integrated fraction of lithium in the particle at 3.7 V and 4.2 V as a function of distance from the center of the particle (r = 0) showing inhomogeneous lithiation in large particles at C/5. (d) Map of the difference in lithium content between the sequential timesteps III and IV (left), IV and V (middle), and V and VI (right). The overall lithium concentration is increasing, but is locally redistributed.

