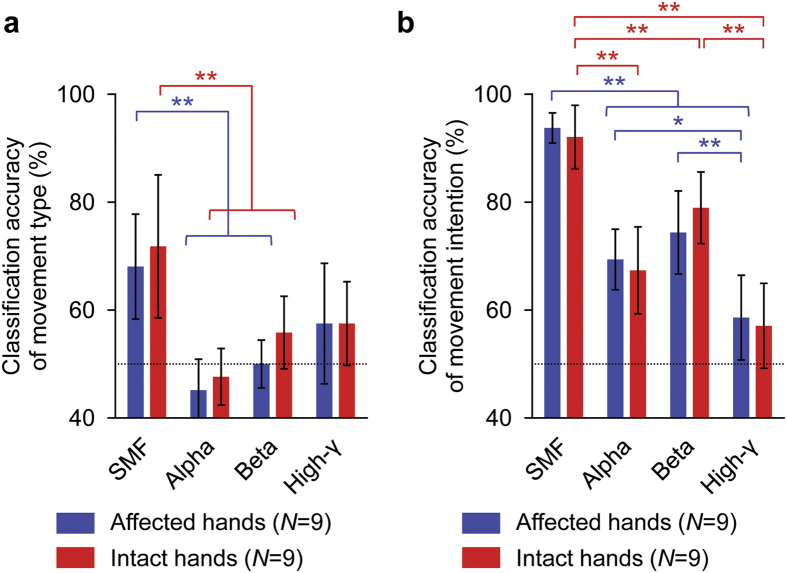
Figure 4. Classification accuracies for different features.
(a,b) Blue and red bars show averaged classification accuracy of movement type (a) or movement intention (b) for affected and intact hands, respectively. Error bars show 95% confidence intervals of classification accuracy. Dotted lines denote chance level. *p < 0.05 and **p < 0.01 significant difference among tested hands (one-way ANOVA with post-hoc Tukey-Kramer).

