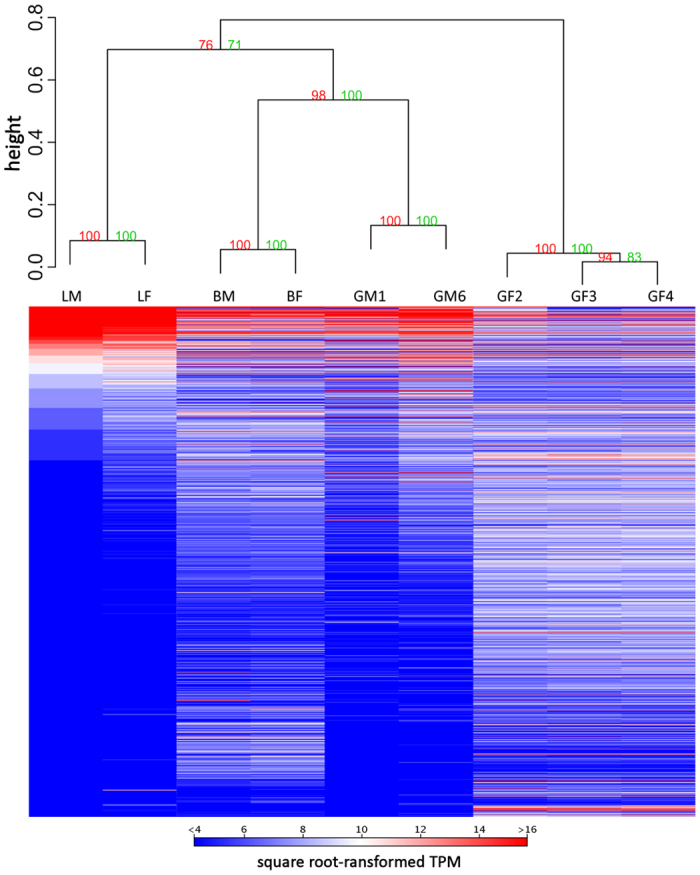
Figure 1.

Hierarchical clustering of the lungfish tissue samples analysed based on gene expression data (see Supplementary Table S1 for details on tissue samples). Square-root transformed TPM values were employed for hierarchical cluster analysis using an average method and correlation-based dissimilarity matrix. Numbers on nodes indicate bootstrap support values. To maximize the visualization of heat map data, only transcripts with a minimum transformed TPM value of 4 in at least one sample are displayed.
