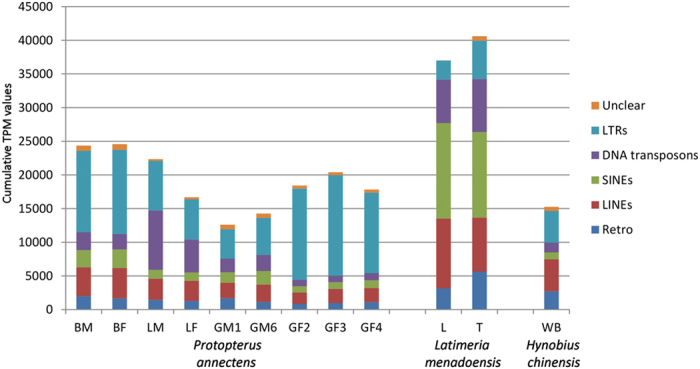
Figure 2. Comparative transcription activity of the main TE classes in the P. annectens, L. menadoensis, and H. chinensis transcriptomes.

Activity is expressed as cumulative TPM values of the elements pertaining to each class. TPM values were calculated on a set of 2,111 evolutionarily conserved genes, as detailed in Materials and Methods. Retro: retroelements that could not be classified with certainty as LTRs or non-LTRs. L: liver; T: testis; WB: whole body.
