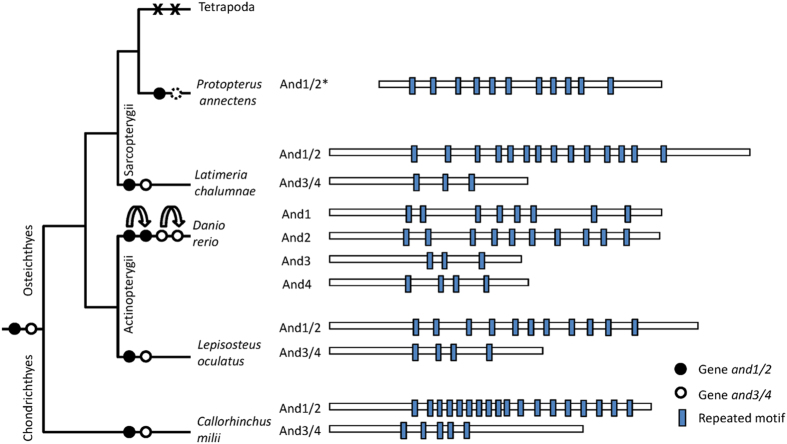
Figure 5. Actinodin (and) gene evolution and protein structures.
Blue boxes: Repeated motif C(N/D)PXXDPXC; black circles: and1/2; white circles: and3/4; dashed circle: putative missing gene; X: gene loss; curved arrow: duplication event; *incomplete sequence at N-ter. Boxes representing proteins reported in scale.

