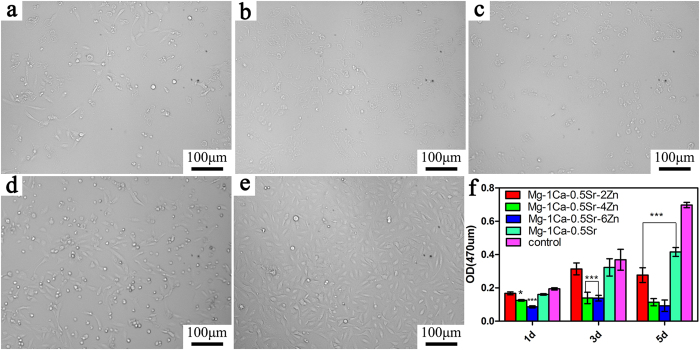
Figure 2. MTT results of the cells cultured in alloy extracts for different days.
Cell morphology was observed by inverted phased contrast microscope on day 5: (a) Mg-1Ca-0.5Sr-2Zn; (b) Mg-1Ca-0.5Sr-4Zn; (c) Mg-1Ca-0.5Sr-6Zn; (d) Mg-1Ca-0.5Sr; (e) Ti-6Al-4V control; (f) OD value of the cells cultured in alloy extracts for different days. *compared to the control group (Ti-6Al-4V), One symbol, p < 0.05; Two symbols, p < 0.01, three symbols, p < 0.001.

