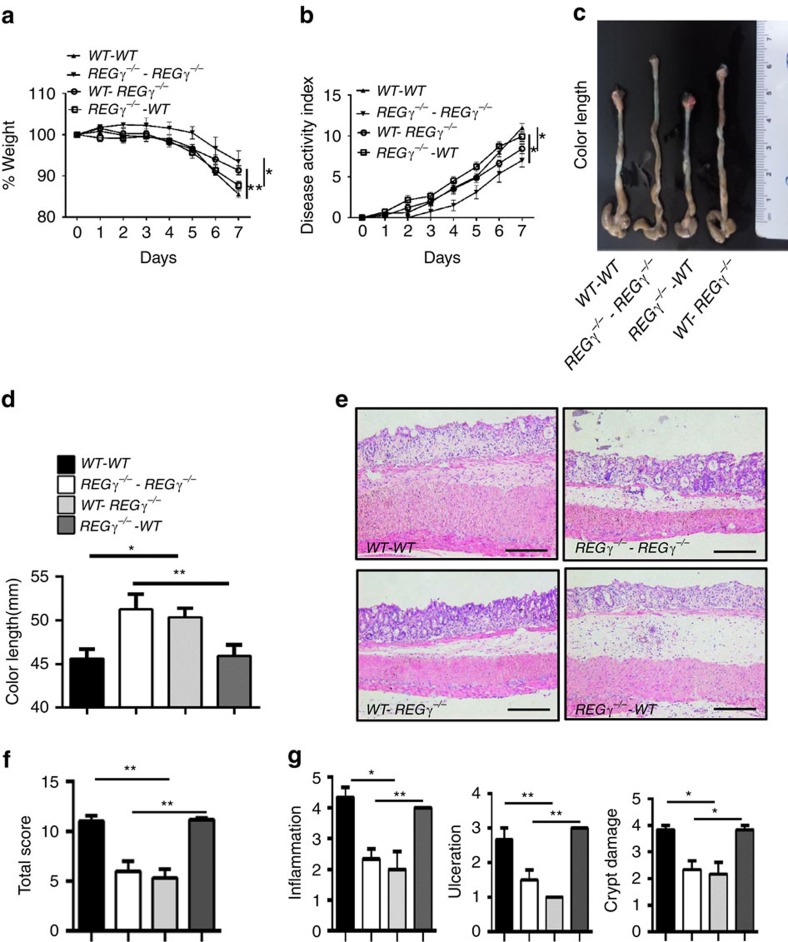
Figure 3. REGγ prominently regulates non-haematopoietic cells contributing to experimental colitis.
(a) Body weight changes in bone marrow transplanted chimera mice. Data are derived from three independent experiments with n=6 (WT–WT group), n=6 (WT-REGγ−/− group), n=7 (REGγ−/−-WT group) or n=7 (REGγ−/−-REGγ−/− group) total, shown in means±s.e.m. *P<0.05; **P<0.01, Student's t-test. (b) Composited DAI scores. n=6/WT–WT group, n=6/WT-REGγ−/− group, n=7/ REGγ−/−-WT group and n=7/REGγ−/−-REGγ−/− group. Data represent means±s.e.m. from three independent experiments. *P<0.05, Student's t-test. (c) Mice were killed at experimental day 7 and a representative colon length in each group was displayed. (d) Statistic analysis of colon lengths. n=6/WT–WT group, n=6/WT-REGγ−/− group, n=7/REGγ−/−- WT and n=7/REGγ−/−REGγ−/−-REGγ−/− group. Data represent means±s.e.m. from three independent experiments. *P<0.05; **P< 0.01, Student's t-test. (e) Histopathological changes in distal colon tissues collected at day 7 by H&E staining. Representative images were shown. Scale bars, 200 μM. (f) Composited HAI. n=3 per group. Data represent means±s.e.m. of one representative experiment with three repeats. **P< 0.01, Student's t-test. (g) Individual histopathology. n=3 per group. Data represent means±s.e.m. for the mice in (f). *P<0.05; **P<0.01, Student's t-test.

