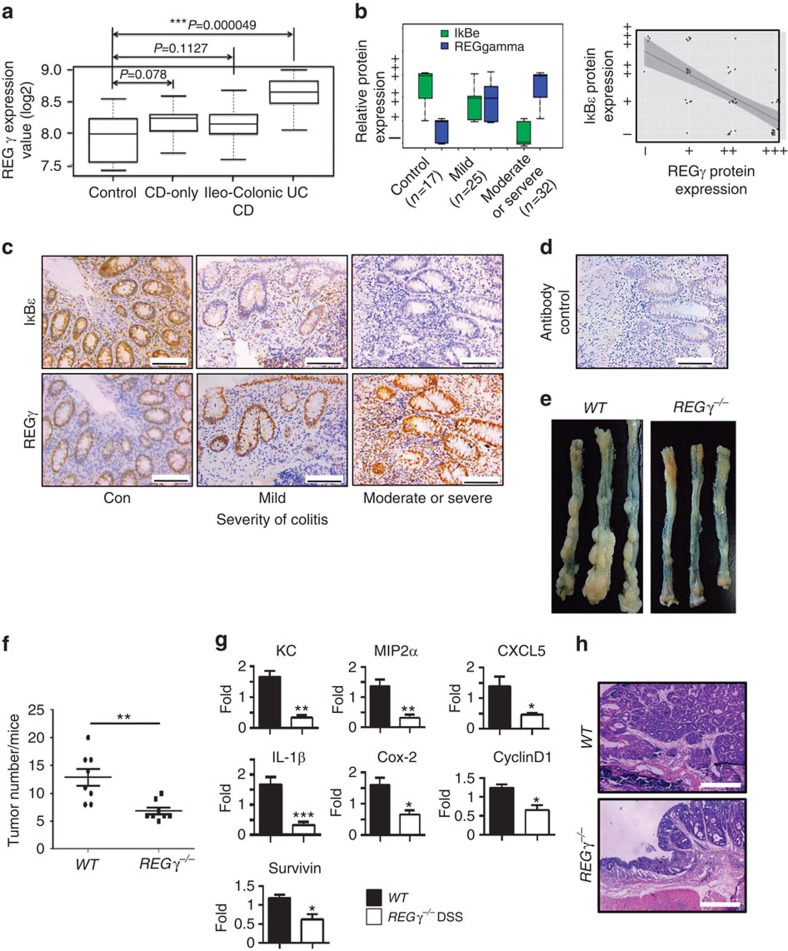
Figure 7. REGγ overexpression correlates with severity of colitis and promotes tumourigenesis in colon.
(a) Boxplot of REGγ expression values (log2) among four groups of microarray data (healthy control, CD-only, Ileo-Colonic CD and UC). Median values are indicated by the transverse line within the box. (b) Correlation between REGγ or IκBɛ protein expression and severity of colitis in controls and patients with UC (left). REGγ expression levels (−∼+++) and IκBɛ Expression levels (−∼+++) were evaluated as described in Methods and were visualized by ggplot2 packages with R language. Correlation between REGγ and IκBɛ protein expressions in controls and patients with UC is displayed (right). By scatter plots and boxplots analysis, correlation between REGγ and IκBɛ were analysed across all the groups. The Pearson correlation is −0.69, P values<0.001(***). All statistical analysis was performed in R.The number of patient samples and controls were indicated. (c) Representative IHC analysis of REGγ and IκBɛ expression in control and UC patients. Scale bars, 100 μm. (d) An IgG control for IHC is shown. (e) Appearances of representative CAC in WT and REGγ−/− mice. (f) The number of tumours in the colons from WT and REGγ−/− mice was quantitated. One representative experiment (n=8 each group) of three repeats is depicted. **P<0.01,Student's t-test. (g) Quantitative RT–PCR analysis of CXCL1, MIP2α, MIP2β, CXCL5, IL-1β, COX-2, Survivin and Cyclin D1 expression in the colon tumours. n=6 per group. Data represent means±s.e.m. from one representative result of three repeats. *P<0.05; **P<0.01; ***P<0.001, Student's t-test. (h) Representative histology of tumours is shown. Scale bars, 500 μm.

