
Figure 4. Microbial co-occurrence in the salivary bacterial population.
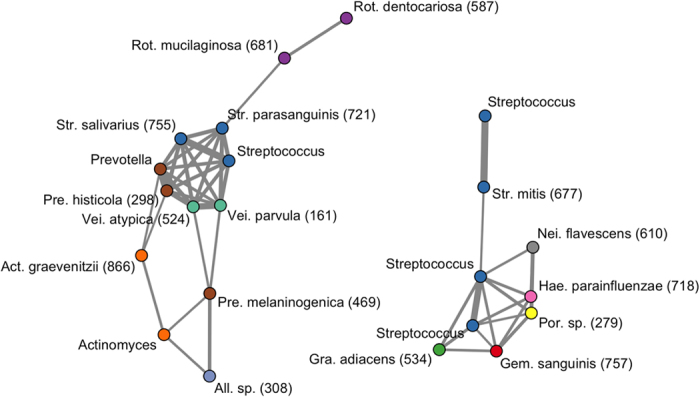
Co-occurrence networks were constructed based on the relative abundances of 22 of 72 core OTUs shown in Fig. 1. The nodes represent the OTU; the nodes with the same color are classified as the same genus. Each edge represents a positive correlation between the two OTUs with an adjusted P value < 10−12 in Pearson’s correlation test, and their thickness corresponds to the coefficient values.