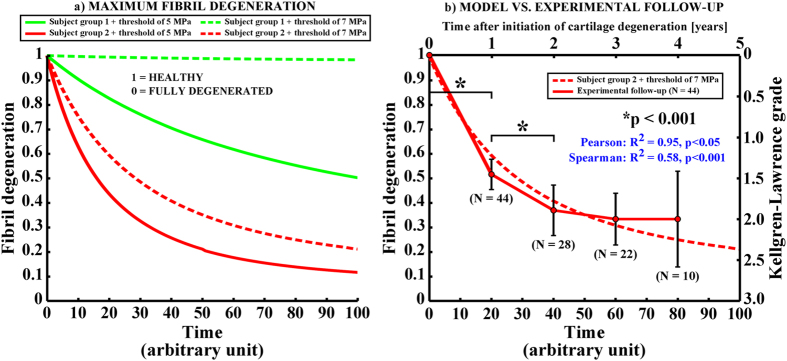
Figure 6.
(a) The maximum fibril degeneration as a function of time (arbitrary units) with thresholds of 5 MPa (solid line) and 7 MPa (dashed line) in the subject group 1 (normal weight, green) and 2 (obese, red). The curves are obtained at the location where the highest fibril degenerations occurred (see locations from Fig. 4), when using the threshold of 5 MPa for the collagen fibril degeneration. (b) The fibril degeneration in the subject group 2 with the threshold of 7 MPa along with an experimentally observed increase in Kellgren-Lawrence grade during the follow-up period for 44 knee joints from 35 obese test subjects (mean ± 95% CI, see also Fig. 2). Since for many patients cartilage degeneration was not initiated during the first year of the follow-up period, the number of patients (N) decreases as a function of time. Nonetheless, the same trend is seen in tissue degeneration both in our novel degeneration algorithm and in experiments. Statistically significant differences in Kellgren-Lawrence grades between adjacent time points are indicated with black stars (*p < 0.001, one-way ANOVA with Tukey’s Post-hoc test). Correlations between experimental follow-up data and simulated cartilage degeneration were calculated with Pearson and Spearman tests using mean experimental values and all observations, respectively.

