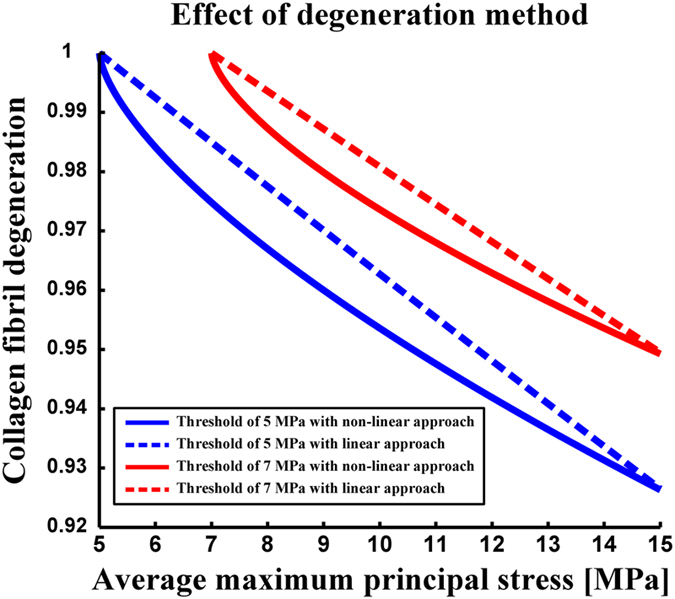
Figure 7. Effect of the degeneration method (linear or nonlinear, equation 1 and equation 5) on the collagen fibril degeneration after one iterative step (one stance phase) in one element with thresholds of 5 MPa (blue curves) and 7 MPa (red curves) for the collagen fibril degeneration.

The non-linear method (equation 1) is indicated with solid lines, whereas the linear method is indicated with dashed lines (equation 5 with x = 4). Non-linear curves represent the collagen fibril degeneration used in the current study. Methods are matched to obtain the same rate of collagen fibril degeneration at 15 MPa stress.
