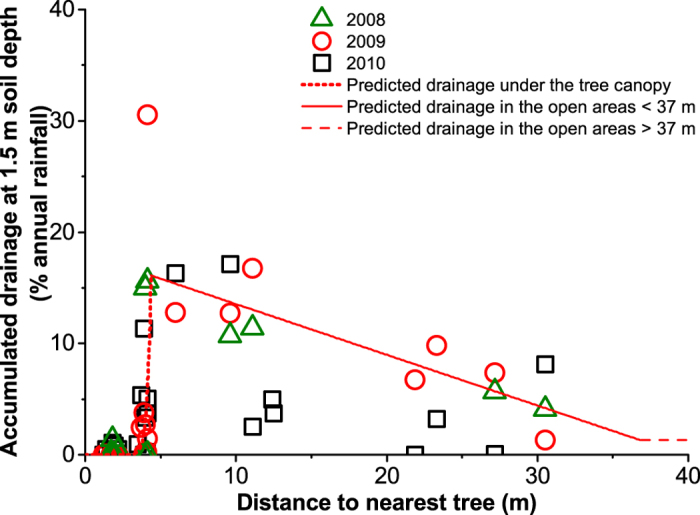
Figure 2. Relationship between accumulated water drainage at 1.5 m soil depth and distance to nearest tree.

Accumulated drainage in open areas decreases with the distance from canopy edges in an agroforestry parkland, Burkina Faso. The lines show the relationship used for spatial simulations which was fitted by least squares regression to the 2009 data (see Methods section for details). The red solid line depicts the linear relationship found in the open areas (y = 18.1 − 0.46x; r2adj = 0.69, p = 0.013), while the red dotted line depicts the exponential relationship found under the tree canopy (y = 4.3 10−8 e4.5x; Lack of Fit test indicated a suitable model; p = 0.983). The dashed line is the constant value for the accumulated drainage corresponding to 1.3% of the annual rainfall assumed for the distance range above 37 m. The number of observations was 18, 22 and 25 in 2008, 2009 and 2010, respectively. In 2008, 2009 and 2010 the rainfall during the sampling period represented 85, 99 and 60% of the annual rainfall, respectively.
