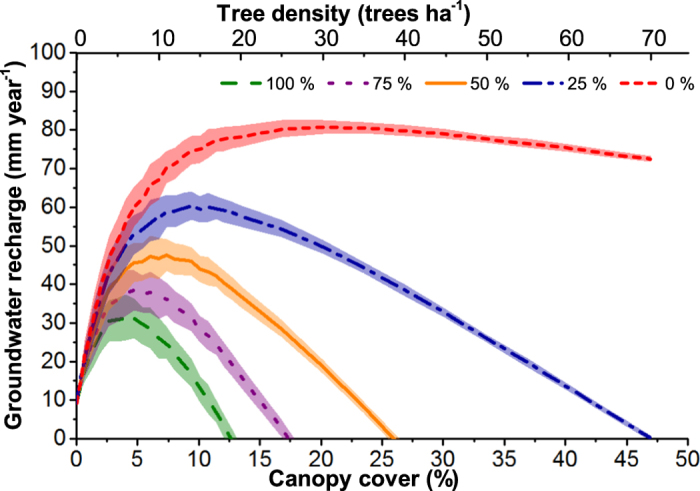
Figure 3. Spatial simulations of groundwater recharge in relation to tree density and canopy cover.

The simulations are based on sap flow measurements and on the observed relationship between drainage below 1.5 m soil depth in 2009 and distance to the nearest tree in an agroforestry parkland, Burkina Faso. For each tree density the averages and standard deviations resulting from 100 simulations with random locations of trees on a 1 ha area are shown. The effect of the proportion (0%, 25%, 50%, 75%, 100%) of tree water uptake below 1.5 m is demonstrated by the different colored lines. Average tree size (67 m2 canopy area) is assumed for all the simulations.
