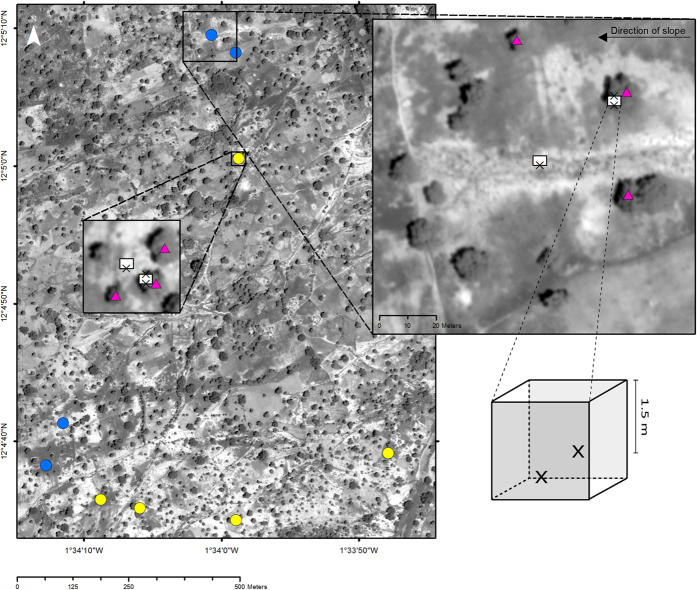
Figure 6. Overview of the study area and sampling design.
Satellite image (Panchromatic WorldView-2 image from 18 July 2012) of the study area showing the 9 sampling locations, 4 corresponding to large open areas (blue dots) and 5 corresponding to small open areas (yellow dots). Enlargements of a large and a small open area are also shown. The soil pits were located in each sampling location both at the centre of the open area and under a tree (white boxes). Soil water drainage was collected with lysimeters located at 1.5 m soil depth at three points in each sampling location (X). Sap flow was measured in three trees per sampling location (pink triangles).

