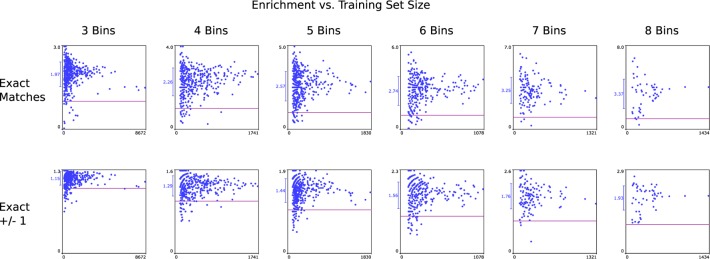
Figure 5.
Unsupervised model building based on 1843 data sets extracted from ChEMBL v20. Results are divided into bin sizes (columns). Each point corresponds to the ratio of correctly predicted bins versus chance of random guessing (enrichment), with a purple line indicating the null hypothesis. The average and standard deviation are marked on the Y-axis. Training set size is shown on the X-axis. The testing sets were made up of 10% of each total data set.

