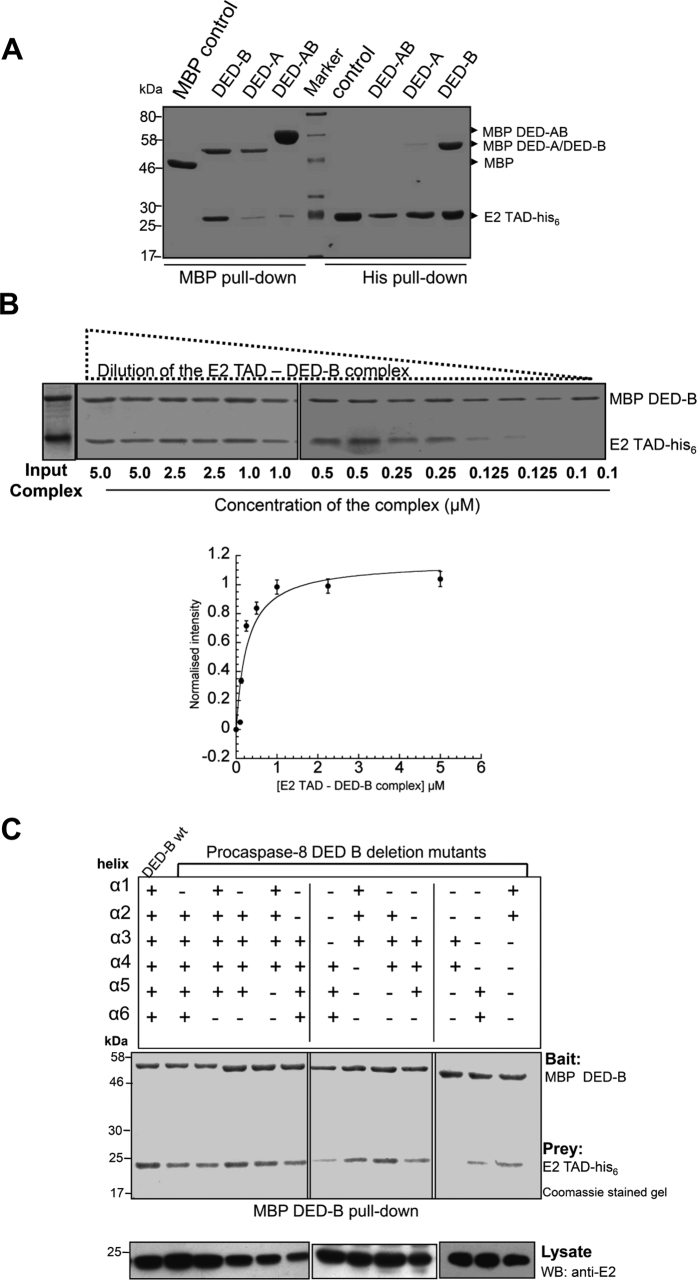
Figure 1. Mapping binding region of E2-procaspase-8 interaction.
(A) Pull-down of E2 TAD and procasapse-8 DED domains. Lanes 1–4 represent MBP pull-down using amylose resin while lanes 6–9 is for reverse his6 pull-down with Ni2+-IDA resin. In lane-1, MBP was checked for binding to E2 TAD-his6, while in lanes 2–4, MBP fused DED-B, DED-A and DED-AB acted as baits. In lanes 6–9, E2 TAD-his6 acted as a bait to monitor the binding of MBP, MBP-tagged DED-AB, DED-A and DED-B respectively. The image is of 12% SDS-PAGE Coomassie-stained gel. (B) Dilution experiment with the isolated E2 TAD – DED-B complex. Top panel-The complex diluted to different final concentrations as indicated were analyzed on SDS-PAGE. The lower panel shows a plot derived from quantitative analysis of background corrected band intensity measured as E2 TAD to DED-B ratio for various dilutions of the complex. The measured intensity is represented as normalized intensity for the data obtained from three independent complex preparations and their dilutions. The error bars show the standard error. (C) MBP pull-down assay of deletion constructs with MBP DED-B and E2 TAD-his6 as bait and prey respectively. 20 μg of the total cell lysate was immunoblotted with anti-E2 antibody to confirm the presence of E2 protein in each sample.

