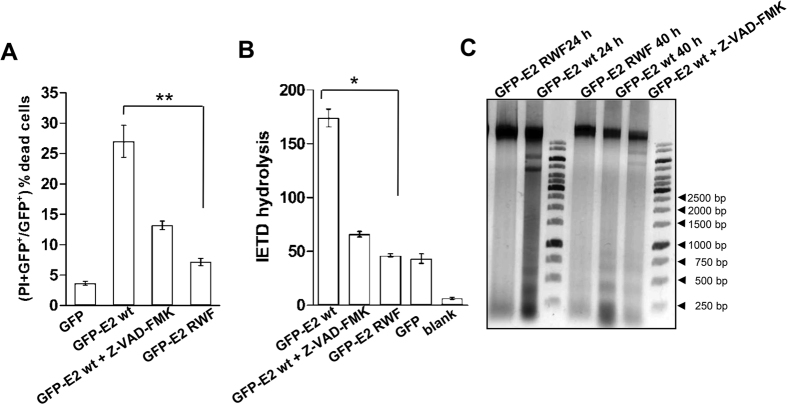
Figure 5. E2-induced cell death analyses.
(A) Percentage of GFP-positive HEK293 dead cells expressing the indicated plasmids was quantified by propidium iodide uptake as described in the Methods section. (B) Caspase-8 activity was measured for the crude extracts isolated from the cells transfected with the plasmids as indicated, using fluorogenic Ac-IETD-AFC substrate. The bars and the error bars represent mean and standard deviation respectively. Statistical analysis using Student’s t-test, *p < 0.05 (A) and p < 0.01 (B). (C) Agarose gel electrophoresis of apoptotic DNA fragments. Total DNA extracted from transfected HEK293 cells was loaded on a 2% agarose gel. A typical DNA ladder consisting of multiples of 180 bp fragments was observed in case of wild-type E2 expressing cells while it was significantly reduced in mutant cells (M stands for 1 kilo-bp DNA marker). In each experiment, cells expressing wild-type E2 incubated with pan-caspase inhibitor (Z-VAD-FMK) was kept as experimental control to monitor that inhibition of the caspases affected substrate cleavage and apoptosis.

