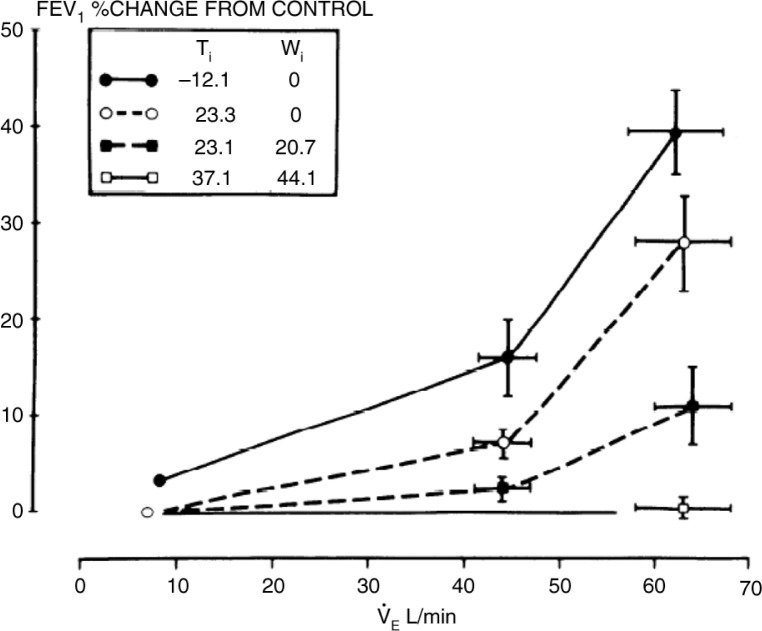
Fig. 8.
Changes that developed in L/sec in FEV1 at various levels of ventilation (VE) and various inspired air conditions for temperature and water content (see inset). Values at extreme left of the graph represent effects of inhaling each gas mixture on lung function at rest as determined from previous studies in the same subjects. Reproduced with permission from (41).

