Figure 1.

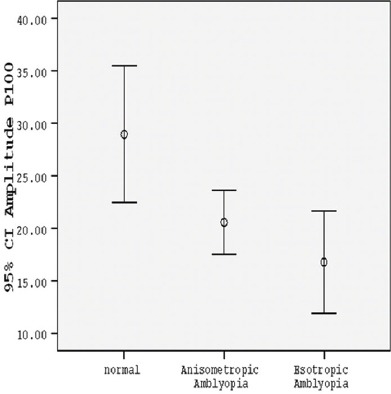
Comparison between the normal group, group with anisometropic amblyopia, and group with esotropic amblyopia according to mean P100 amplitude with small check-size stimuli in 100% contrast.

Comparison between the normal group, group with anisometropic amblyopia, and group with esotropic amblyopia according to mean P100 amplitude with small check-size stimuli in 100% contrast.