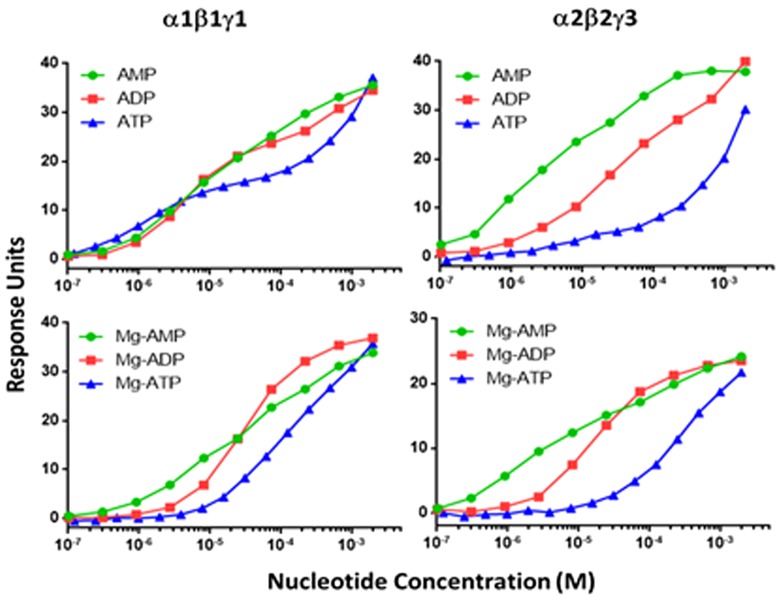
Figure 3. Comparison of nt binding to α1β1γ1 and α2β2γ3 complexes in the presence and absence of Mg2+using SPR techniques.
A representative dose-dependent SPR response run on nt binding to α1β1γ1 and α2β2γ3 is shown. Data are mean (n=3), and curves were generated using best-fit values. The binding affinities were calculated using a steady-state affinity algorithm. The KD values calculated from the curves are shown in Table 2.

