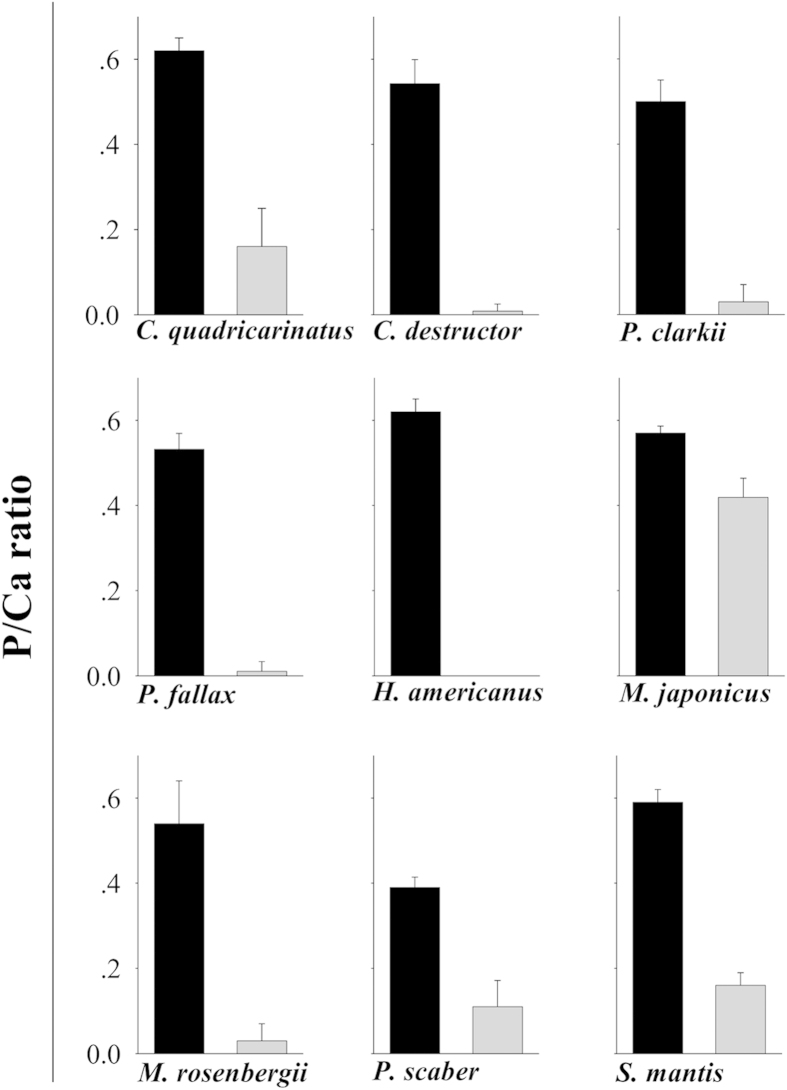
Figure 2. EDS analysis comparing P/Ca ratios in the teeth processes (black) and the mandibular basal segment (gray) of 9 representative crustacean species (see Table 1) that deposit calcium phosphate on their teeth.
Error bars are s.d. for the typical atomic ratio of various calcium phosphate minerals (see Fig. S2).

