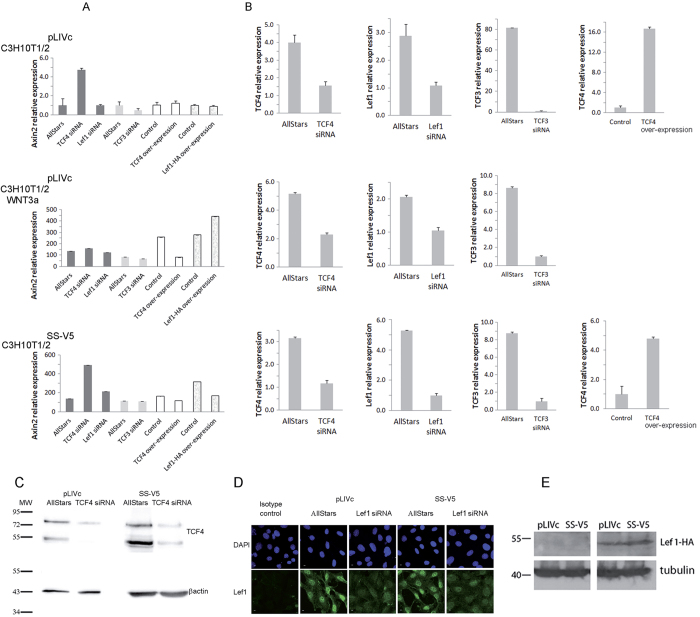
Figure 4. Implication of TCF/LEF family members in regulating AXIN2 expression.
(A) Q-PCR analysis of AXIN2 in unstimulated or Wnt3a-stimulated (0.1 μM, 24 hrs) C3H10T1/2pLIVc (pLIVc) and C3H10T1/2SS18-SSX1-V5 (SS-V5) cells depleted of or over-expressing individual TCF members as indicated. Depletion was achieved using a pool of specific or control siRNA (AllStars). (B) (first 3 columns): Depletion of each TCF/LEF (as indicated) was verified in each cell population by Q-PCR. B (right columns): Over-expression of TCF4 was measured by Q –PCR. (C) TCF4 depletion was verified by Western blot analysis using an anti-TCF4 antibody and anti-βactin as loading control; (D) LEF1 depletion was verified by immunofluorescence microscopy using an anti-LEF1 antibody. (E) Over-expression of HA-tagged LEF1 was assessed by Western blot analysis using an anti-HA antibody and anti-tubulin antibody as loading control.

