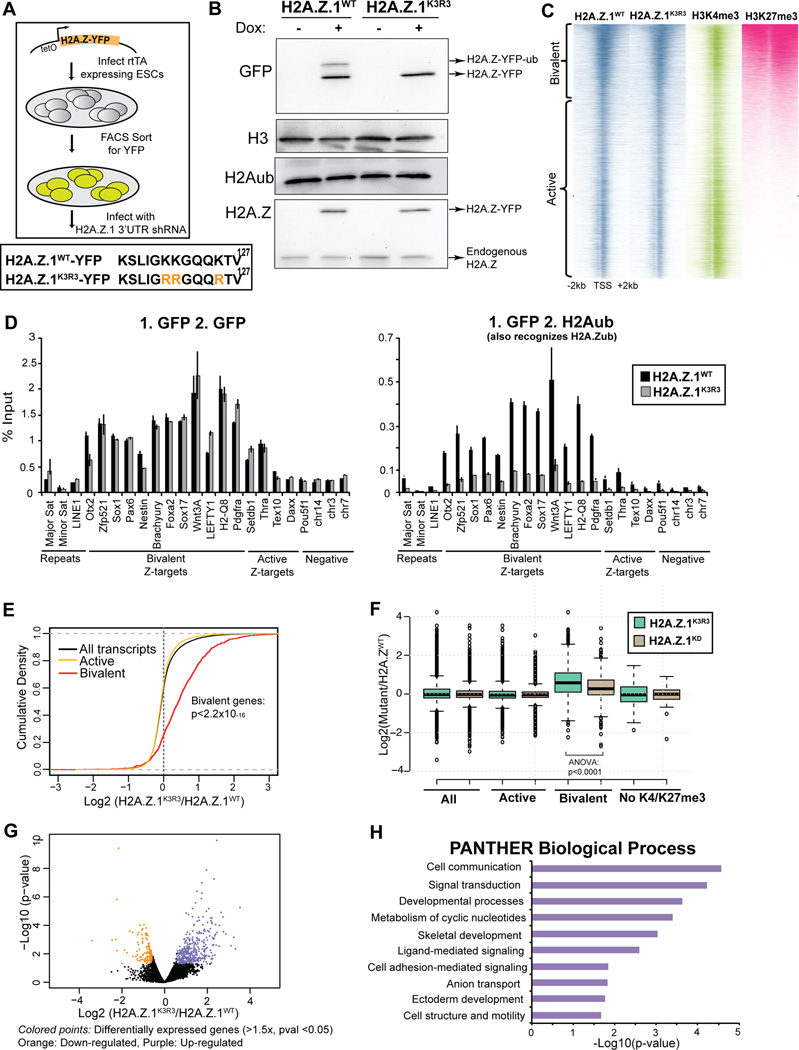
Figure 1. H2A.Z.1ub regulates bivalent genes in mESCs.
A. mESCs expressing rtTA were infected with lentiviral particles with H2A.Z.1K3R3 and H2A.Z.1WT transgenes harboring a C-terminal YFP, under the control of a tetOn promoter. Lower panel shows the modified C-terminal lysine H2A.Z.1 residues. Upon addition of doxycycline, YFP+ cells were sorted and infected with a hairpin against the 3’UTR of endogenous H2A.Z.1. B. Immunoblots of H2A.Z.1WT and H2A.Z.1K3R3 mESC histone extracts were probed with GFP, H3, H2Aub and H2A.Z antibodies. C. Heatmap of ChIP-seq in H2A.Z.1WT and H2A.Z.1K3R3 mESCs displays similar incorporation at active and bivalent target genes. H3K4me3 and H3K27me3 (Wamstad et al., 2012) are included for comparison. Heatmaps are centered on transcriptional start sites (TSSs) of all genes ranked by H2K27me3 and extend +/− 2kb. Bivalent gene classification is from Subramanian et al., 2013. D. Sequential ChIP using GFP followed by GFP or H2Aub (also recognizes H2A.Zub) antibodies. % Input is calculated using 2(Cp(Input)-Cp(ChIP))))*(%of total input). Error bars represent standard deviation of triplicate reactions. E. Distribution of the log2 fold change in expression in H2A.Z.1K3R3 mESCs was plotted using cumulative density function of log2(H2A.Z.1K3R3/H2A.Z.1WT). Black trace represents all genes with RPKM of at least 1 in any sample and 5 unique reads in each sample. Active (yellow trace) and bivalent (red trace) gene classes that pass threshold were plotted independently. F. Box plots represent the log2 fold change in expression of either H2A.Z.1K3R3 or H2A.Z.1KD mESCs relative to H2A.Z.1WT mESCs at all (13857 genes), active (11010), bivalent (1611) or K4me3−/K27me3− (61) genes. Classification of bivalent and active genes are from Subramanian (2013). Center line represents median value; box limits indicate the 25th and 75th percentiles; whiskers extend 1.5 times the interquartile range from the 25th and 75th percentiles, outliers are represented by dots. G. Volcano plot of all genes that passed detection threshold were plotted by p-value vs. change in expression. H. Top 10 enriched categories using PANTHER Biological Process database are displayed for up-regulated genes compared to all genes. See also Figure S1–2.

