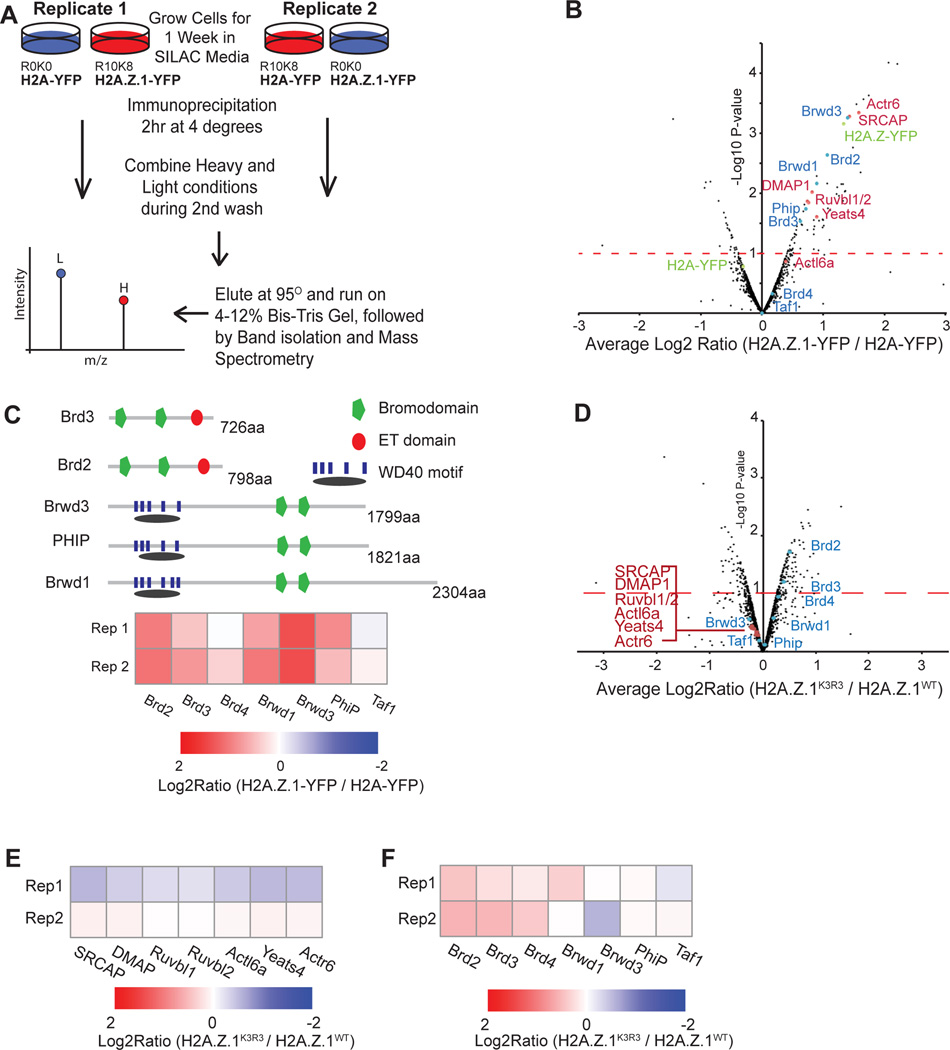
Figure 4. H2A.Z.1ub interacts with chromatin-associated proteins in mESCs.
A. Schematic of SILAC-IP approach. B. Volcano plot of average ratio of enrichment of SILAC intensity for H2A.Z.1-YFP over H2A-YFP against p-value for significance of reproducibility. Bait proteins are indicated in green. Proteins in red are members of the SRCAP complex. Proteins in blue are tandem bromodomain proteins. C. Heatmap of SILAC Log2 ratio of H2A.Z.1-YFP IP over H2A-YFP IP for all tandem bromodomain proteins expressed mESCs. D. Volcano plot of average ratio of enrichment of SILAC intensity for H2A.Z.1WT-YFP over H2A.Z.1K3R3-YFP against p-value for significance of reproducibility. Proteins labeled as above. E. Heatmap of Log2 ratio of H2A.Z.1K3R3-YFP vs. H2A.Z.1WT-YFP intensity for SRCAP complex proteins from SILAC-IP. F. Heatmap of Log2 ratio of H2A.Z.1K3R3-YFP vs. H2A.Z.1WT-YFP intensity for tandem bromodomain proteins from SILAC-IP. See also Figure S5.

