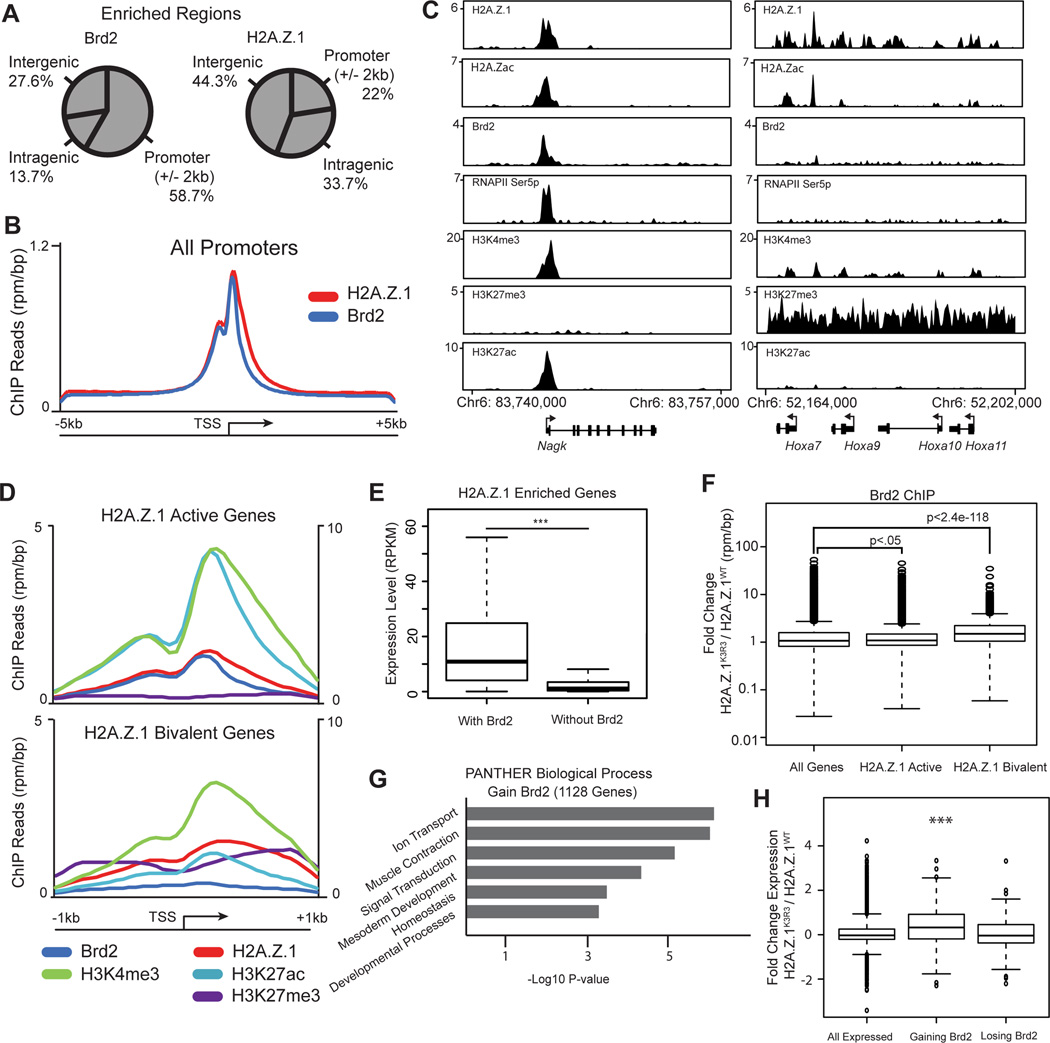
Figure 5. H2A.Z.1ub prevents Brd2 recruitment to bivalent genes.
A. Genomic distribution pattern of Brd2 and H2A.Z.1 using CEAS (Shin et al., 2009). B. Average signal of ChIP-seq reads across the TSS of all genes (+/− 5kb) for Brd2 and H2AZ.1. C. Genome tracks of representative active and bivalent H2A.Z.1 target genes. Reads are normalized to reads per million per base pair. D. Average ChIP-seq reads for Brd2, H2A.Z.1, H3K4me3, H3K27ac and H3K27me3 across the TSS of active and bivalent H2A.Z.1 enriched genes (+/− 1kb of TSS) (Subramanian et al., 2013). H3K4me3 is plotted on secondary axis to the right. E. mRNA levels as measured by RNA-seq of H2A.Z.1 enriched genes with or without Brd2 (p-value < 1e−142, two-sided t-test). RPKM=reads per kilobase per million. Boxplot indicates median and 25th and 75th percentile mRNA level, whiskers extend 1.5 times the interquartile range. F. Box and whisker plot of median fold change in Brd2 ChIP-seq reads across the promoter regions (TSS +/− 300bp) of all genes as well as H2A.Z.1 enriched active and bivalent genes. Box and whiskers defined as in E. G. GO analysis of genes gaining Brd2 at their promoter as determined by DAVID (Huang et al., 2009a; 2009b). H. Box and whisker plot of the median fold change in expression of genes gaining Brd2 >2-fold at promoters (p-value 6.3e−11, un-paired t test) and losing Brd2 (not significant). Box and whiskers defined as in E. See also Figure S6.

