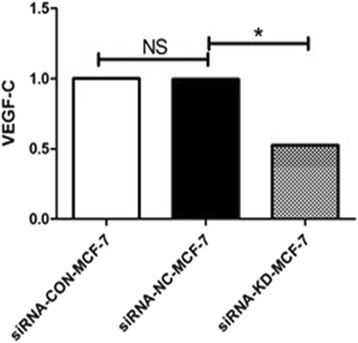
Fig. 1.

VEGF-C mRNA expression measured by real-time fluorescent quantitative PCR in siRNA-MIF-MCF-7 cells, siRNA-NC-MCF-7 cells, and MCF-7 cells. GAPDH was used as the internal control. The differences between groups were analyzed by two-tailed Student’s t test, with *P < 0.05 considered significant. NS means there was no statistically significant difference. The experiment was repeated three times independently
