
Fig. 1.
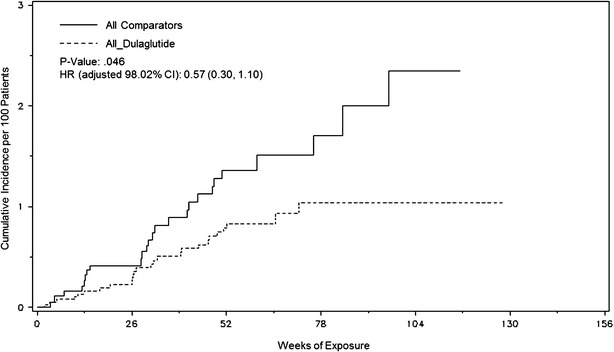
Time to first primary 4-component MACE. A Kaplan–Meier plot (with estimated HR [98.02 % CI] and p value) illustrating the time in weeks from randomization to the first occurrence of any of the 4 components of the primary endpoint measure
Official websites use .gov
A
.gov website belongs to an official
government organization in the United States.
Secure .gov websites use HTTPS
A lock (
) or https:// means you've safely
connected to the .gov website. Share sensitive
information only on official, secure websites.
Time to first primary 4-component MACE. A Kaplan–Meier plot (with estimated HR [98.02 % CI] and p value) illustrating the time in weeks from randomization to the first occurrence of any of the 4 components of the primary endpoint measure