
Fig. 2.
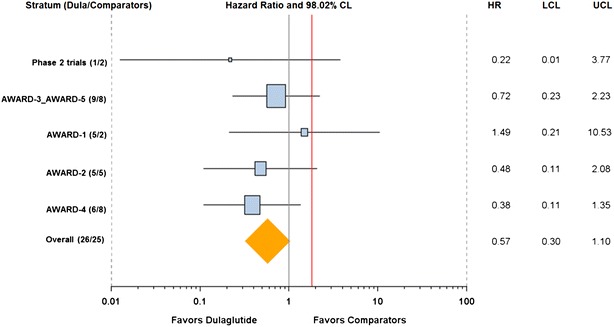
Forest plot of the primary 4-component MACE endpoint by stratum. A comparison of the primary analysis results (HR [98.02 % CI]) in each stratum (study or combinations of studies by which the primary analysis was stratified) with the overall result. Numbers of CV events per each treatment group (Dula/Comparators) are indicated in the parentheses in the y-axis under Stratum