
Fig. 6.
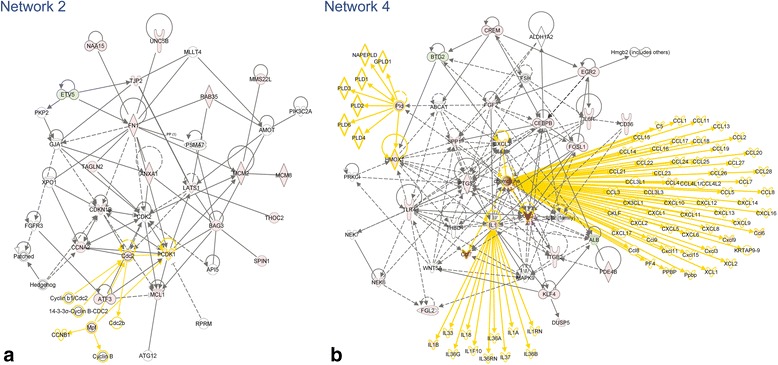
Examples of TBI-I networks. TBI-I CD networks 2 (a) and 4 (b) (see Table 2) with all gene families, groups and complexes expanded to show the member genes and showing the relative expression values of potential GOI for TBI-I. red: relative increase in expression; green: relative decrease in expression; white: no change in expression; gold connections and outlines: expansion of gene families, groups and complexes in the original network