
Fig. 4.
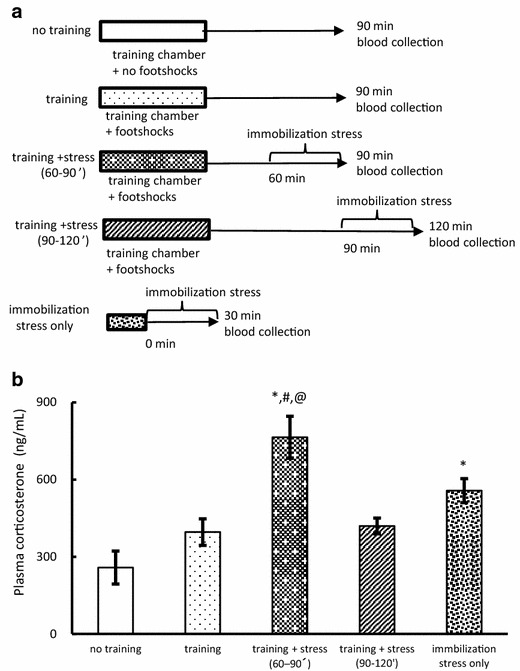
Plasma corticosterone levels (Experiment 5). a Experimental protocol for blood sample collection. b Comparison of plasma corticosterone levels (n = 5). Data are expressed as mean ± SEM. *P < 0.05 compared with no training group. # P < 0.05 compared with training group. @ P < 0.05 compared with training + stress group (90–120 min)