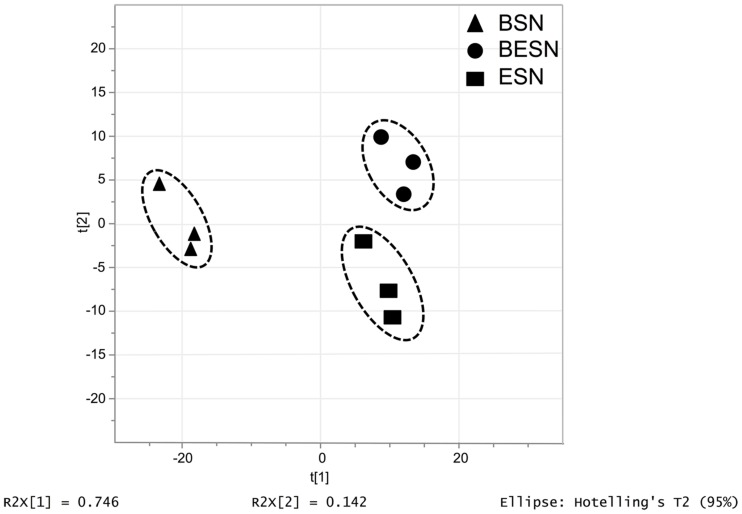
FIGURE 7.
Principal Component Analysis (PCA) plot carried out for metabolite profiles (exometabolome) detected from supernatants from the bacterial isolate Halomonas sp. Z3 culture (BSN), strain Z3 and Ectocarpus sp. co-culture and axenic Ectocarpus sp. culture (ESN). The score plot was obtained using 320 monoisotopic peaks quantified by UPLC-MS in positive ionization mode. All metabolites were considered for PCA (p-value < 0.05) generated by SIMCA-P v12.0.

