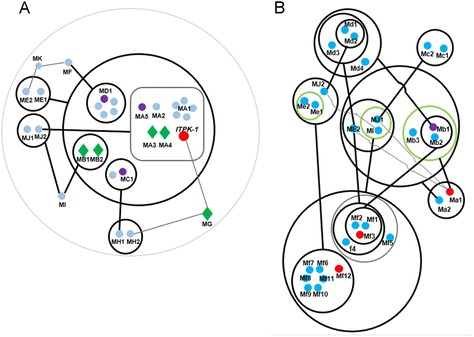
Fig. 4.

Sub-networks of “magenta2”. a sub-network 1 of “magenta2”. b sub-network 2 of “magenta2”. Thick circles are power nodes and genes in green circles are connected to each other; thick lines are power edges, and the fine gray lines are common edges. Red, nodes related to inositol phosphate or possible candidate genes; green diamonds, transcription factors; violet nodes, other inositol phosphate-related genes; and blue nodes, other genes without direct inositol phosphate-related annotation. The sub-networks were manually redrawn to clarify the nodes and edges. The original network and node annotations are shown in Additional file 4
