
Fig. 2.
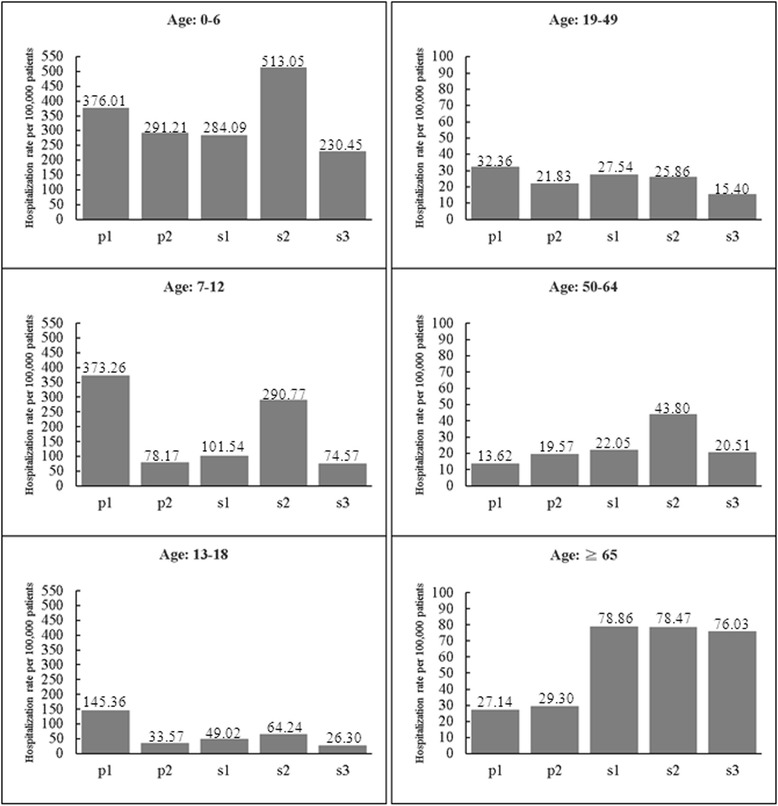
Age-specific hospitalization rate during the five periods. The periods p1 and p2 were pandemic periods, whereas s1, s2 and s3 were seasonal periods
Official websites use .gov
A
.gov website belongs to an official
government organization in the United States.
Secure .gov websites use HTTPS
A lock (
) or https:// means you've safely
connected to the .gov website. Share sensitive
information only on official, secure websites.
Age-specific hospitalization rate during the five periods. The periods p1 and p2 were pandemic periods, whereas s1, s2 and s3 were seasonal periods