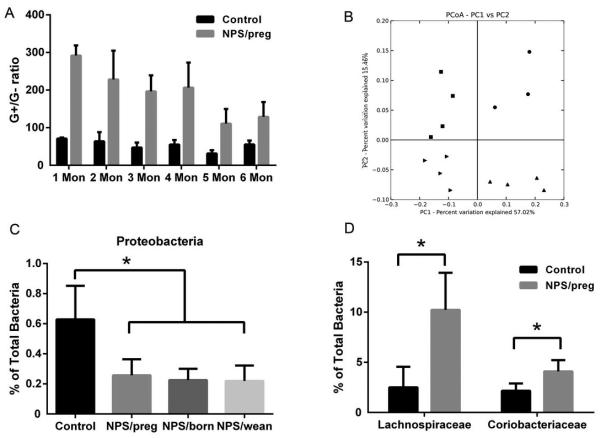
Fig. 2. Change of gut microbiota after NPS treatment.
A. Gram positive : Gram negative bacteria (G+/G−) ratio in fecal samples from mice given NPS during gestation ( NPS/preg) and control NOD mice at different ages by qPCR using specific primers for G+ and G− bacteria. B. PCoA analysis of gut microbiota 16S rRNA sequence data from mice treated with NPS during gestation (NPS/preg, squares in upper left quadrant), NPS in the neonatal period (NPS/born, upward triangles, lower right quadrant), NPS after weaning (NPS/wean, rightward triangles, lower left quadrant) and untreated NOD mice (dots, upper right quadrant). C. Sequencing results showing the proportion of Proteobacteria, as a percentage of total bacteria. Statistical differences were analyzed by t-test, *: p<0.05. D. Comparison of two G+ families, Lachnospiraceae and Coriobacteriaceae, belonging to the Firmicutes phylum, as a percentage of total bacteria. Statistical differences were analyzed by t-test, *: p<0.05.

