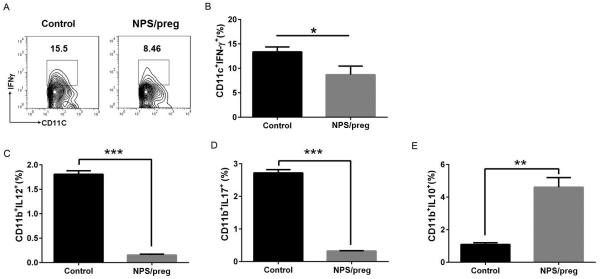
Fig. 5. Cytokine expression profiles of antigen-presenting cells.
A: Representative FACS plot of IFNγ+ cells gated on CD11c+ cells from control NOD or NPS/preg mice. B: The percentage of IFN-g+ CD11c+ cells in splenocytes from control NOD or NPS/preg mice (n=4/group). Statistical analysis was performed by t-test, *: P<0.05. C-E: The percentage of CD11b+IL-12+ (C), CD11b+IL-17+ (D) and CD11b+IL-10+ (E) cells between control NOD and NPS/preg (n=4/group). Statistical analysis was performed by t-test, *: P<0.05, **: p<0.01, ***: p<0.001.

