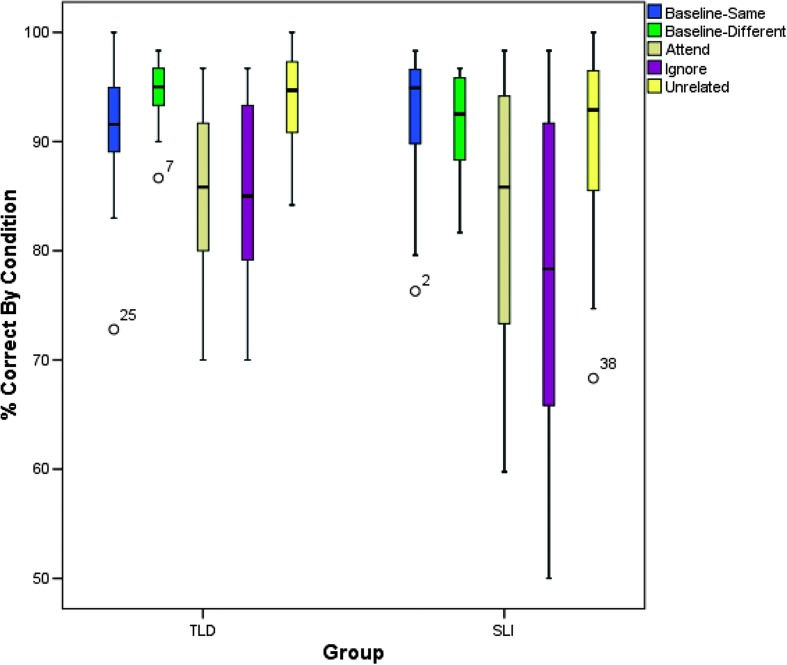
Figure 2.
Box plots for accuracy rates (percentage correct responses) by condition for participants with typical language development (TLD) and specific language impairment (SLI). Box plots display group medians, first and third quartiles, 10th and 90th percentiles, and outliers. Numbers associated with outliers refer to individual case numbers.

