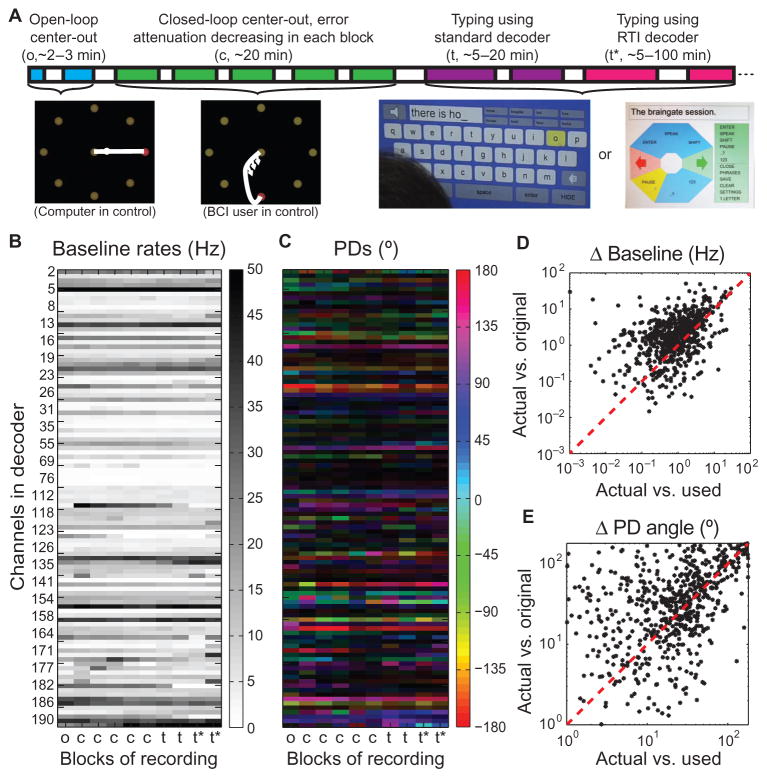
Fig. 1. Neural signal nonstationarities.
(A) Session timeline. Following an open-loop reference and decoder initialization block, a standard decoder was calibrated using several closed-loop center-out blocks, each lasting 3 to 5 min. Using the standard decoder, the participant then typed words, phrases, sentences, and/or paragraphs in either a QWERTY or a radial virtual keyboard. An RTI-based decoder was calibrated using only the neural data acquired during typing, and the participant continued typing using an RTI decoder until the end of the session. (B) Mean threshold crossing rates in each block of an example session (participant T7’s trial day 293), showing each channel that was used by the decoder for at least one block in the session. Blocks are labeled as in (A). Every third channel is labeled with its electrode number (in this session, 80 of 192 possible channels were selected for decoding in each block). For better visualization of the dynamic range of rate changes across blocks, rates are capped at 50 Hz (the highest actual whole-block baseline rate in this session was 68.3 Hz). (C) Directional tuning of the same channels in (B), obtained by regressing firing rates against target directions. Color represents the estimated PD, and the brightness of the color is proportional to the channel’s normalized modulation index. (The same PDs are shown in polar coordinates in fig. S3.) (D) The difference between each unit’s baseline rate in each block (“actual”) and the rate used by the decoder in that block (“used”; that is, the previous block’s baseline rate) is plotted against the difference between that unit’s baseline rate in that block and its rate in the first block (“original”), which would have been used by the decoder for the whole session if features were not being updated. (E) The angular difference between each unit’s measured PD in each block and the tuning model used by the decoder for that unit in that block (“actual vs. used”) is plotted against the angular difference between the measured PD in that block and in the first block (“actual vs. original”), which would have been the tuning model if the decoder were never recalibrated after the first block.

