
Fig. 3. RTI decoder calibration.
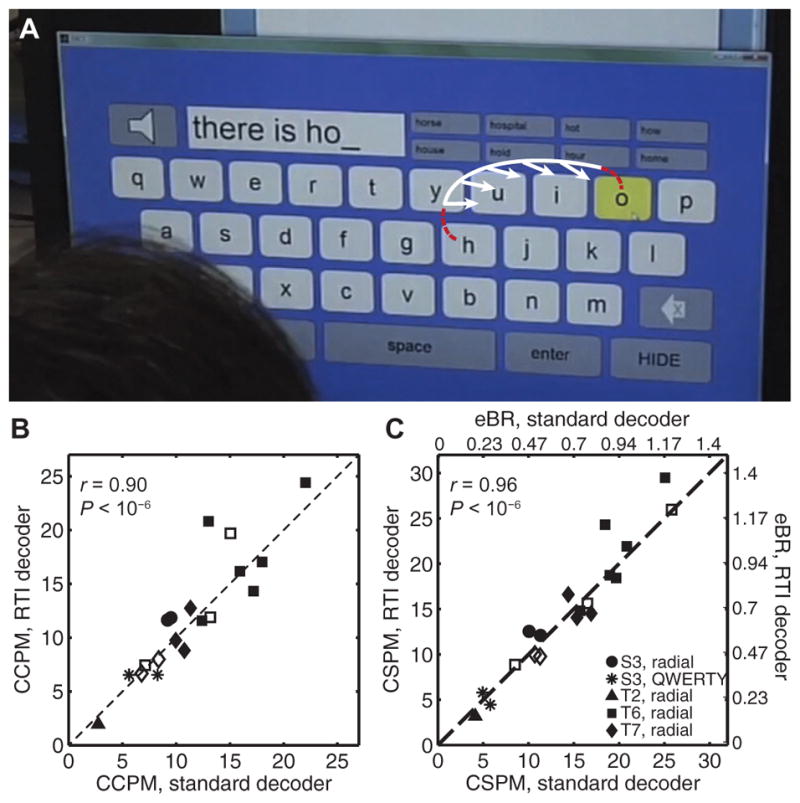
(A) To obtain a tuning model from data acquired during neural control in a practical BCI application, such as a virtual keyboard (14), the user’s intended movement direction is retrospectively inferred to be directly toward the next selected target (white arrows). The white curve reflects the portion of the preceding cursor trajectory assumed to result from the person’s movement intent and is used toward RTI decoder calibration. The red dashed segments of the trajectory are excluded from decoder calibration. The intended direction vectors are regressed against the corresponding neural activity to calibrate the RTI decoder. (B) Typing performance using the RTI decoder versus the standard decoder, measured using the number of CCPM. Data are from 19 sessions across four participants, including 5 self-paced typing sessions (3 from participant T6 and 2 from participant T7, shown in unfilled markers). The within-session correlation coefficient r and its corresponding P value are shown in plot. (C) Typing performance using the RTI decoder versus the standard decoder, measured using the number of CSPM. For the radial keyboard, this metric can be translated into extrapolated bitrate (eBR = CSPM × log2(N − 1)/60, where N = 8 targets). The eBR scale only applies to the radial keyboard sessions, not to the two sessions in which the QWERTY keyboard was used (*); for the QWERTY keyboard, eBR could not be computed easily because of the large variability in the size of the targets. Within-session correlation coefficient and P value are shown in plot. P values in (B) and (C) were obtained by comparing the measured value to a null distribution obtained by shuffling the pairings 1,000,000 times.