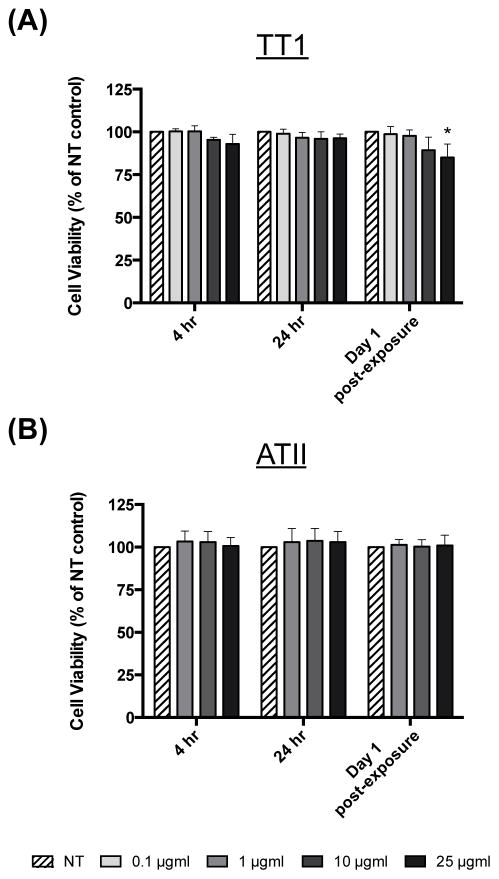
Figure 5.
Viability of TT1 and ATII cells
Viability of (a) TT1 and (b) ATII cells, following 4 and 24 hours treatment with AgNWs and after a post-exposure recovery period. Cell viability data is presented as a % of the non-treated (NT) control (n=3) ± SEM; significant differences between non-treated and treated cells are indicated where * P < 0.05.

