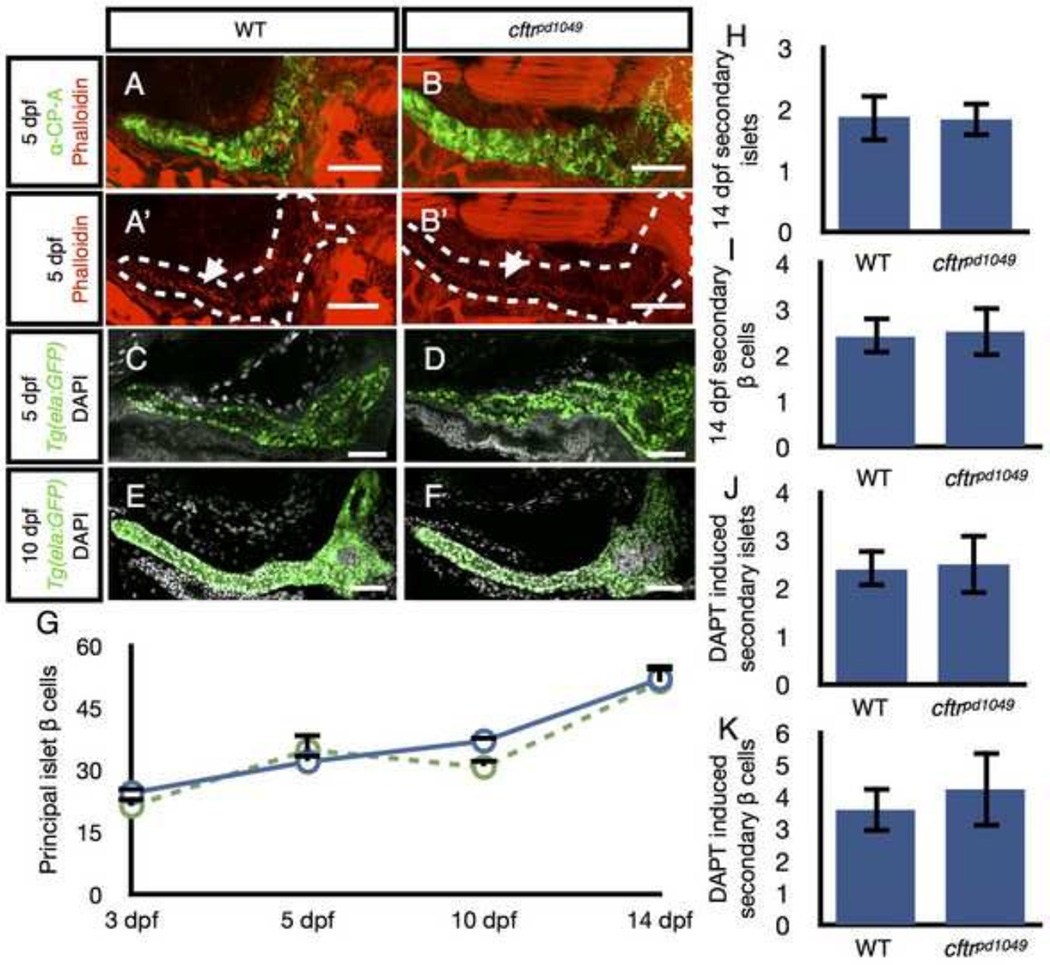
Figure 3. Development of the cftr mutant pancreas.
(A) Wholemount confocal image of WT pancreas stained with anti-carboxypeptidase (CP-A) to detect acinar cells and phalloidin to mark actin at the apical membrane of the pancreatic duct. (A’) Associated WT image without anti-CP-A to better visualize the contiguous actin strip along the length of the duct indicative of a continuous lumen. (B) Wholemount confocal image of a cftr pancreas stained with anti-CP-A and phalloidin. The actin network is contiguous in cftr mutants indicative of a continuous lumen. (C–F) Wholemount WT and cftr mutant samples expressing ela:GFP to mark acinar tissue and stained with DAPI to mark nuclei at (C,D) 5 dpf and (E,F) 10 dpf. (G) Quantification of principal islet β cells at several stages. (H) Quantification of total number of secondary islets at 14 dpf and (I) total number of secondary β cells at 14 dpf. WT, n=7; cftrpd1049 n=6. (J) Quantification of DAPT induced secondary islets and (K) total number of DAPT induced secondary islet β cells. WT, n=5; cftrpd1049, n=4. Error bars represent s.e.m. Scale bars = 50 µm.

