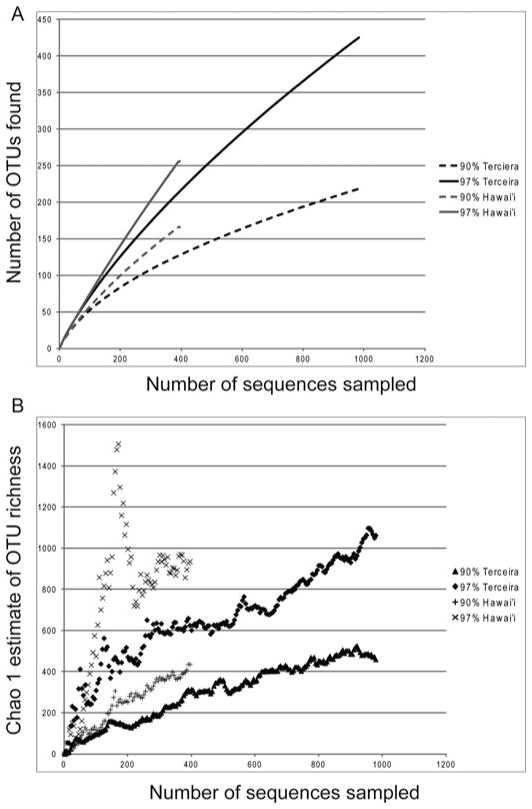
Fig. 4.
Rarefaction and Chao1 Estimate of Richness for Hawai’i and Terceira. Collection curves estimated at 97% and 90% sequence similarity. (A) Rarefaction curves show that sampling at both taxonomic levels do not captures all diversity present. (B) Chao1 estimate indicate that Hawai’i has higher diversity than Terceira.

