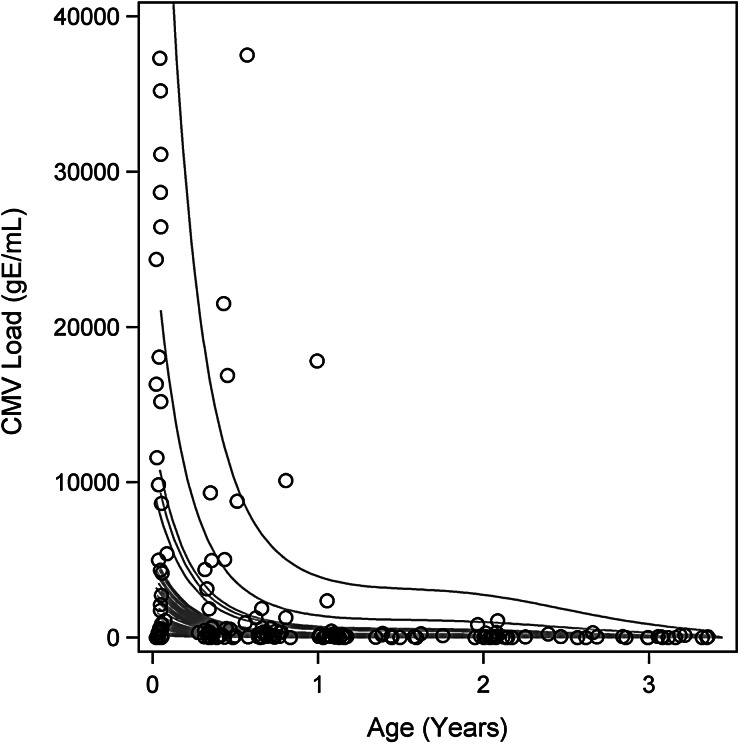
Figure 1.
Cytomegalovirus (CMV) urine viral load of each individual child in the cohort for the first 3 years of life. Gray lines are fitted trajectories of CMV viral load for individual children from the fit of the shared random effect model and thus include adjustment for bias in quantitative polymerase chain reaction (qPCR) results by the shell vial culture gold standard. Open circles are observed values. The vertical axis is truncated just above the 97.5th sample percentile of the qPCR data to facilitate display of data. The 2 largest observed qPCR values were 405, 691 genomic equivalents/mL (gE/mL), and 1,797,655 gE/mL.

