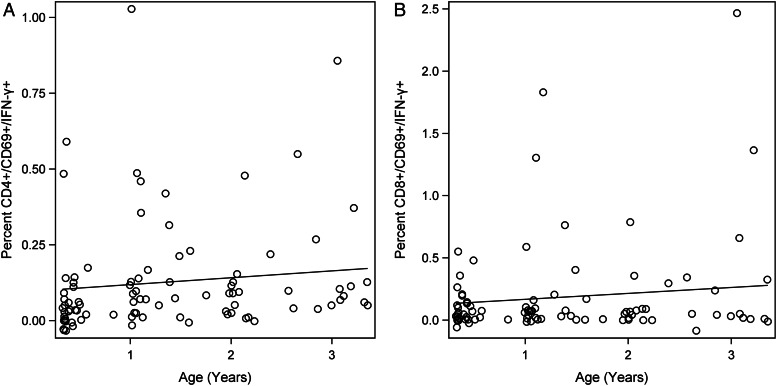
Figure 3.
Kinetics of cytomegalovirus (CMV)-specific CD4 (A) and CD8 (B) T-cell responses for the first 3 years of life. Black line represents trajectory for the average child. Open circles represent observed values. Estimated coefficient of multiple determination (R2) is 0.085 and age trend P < .0001 for both CMV-specific CD4 and CD8 T-cell responses.

