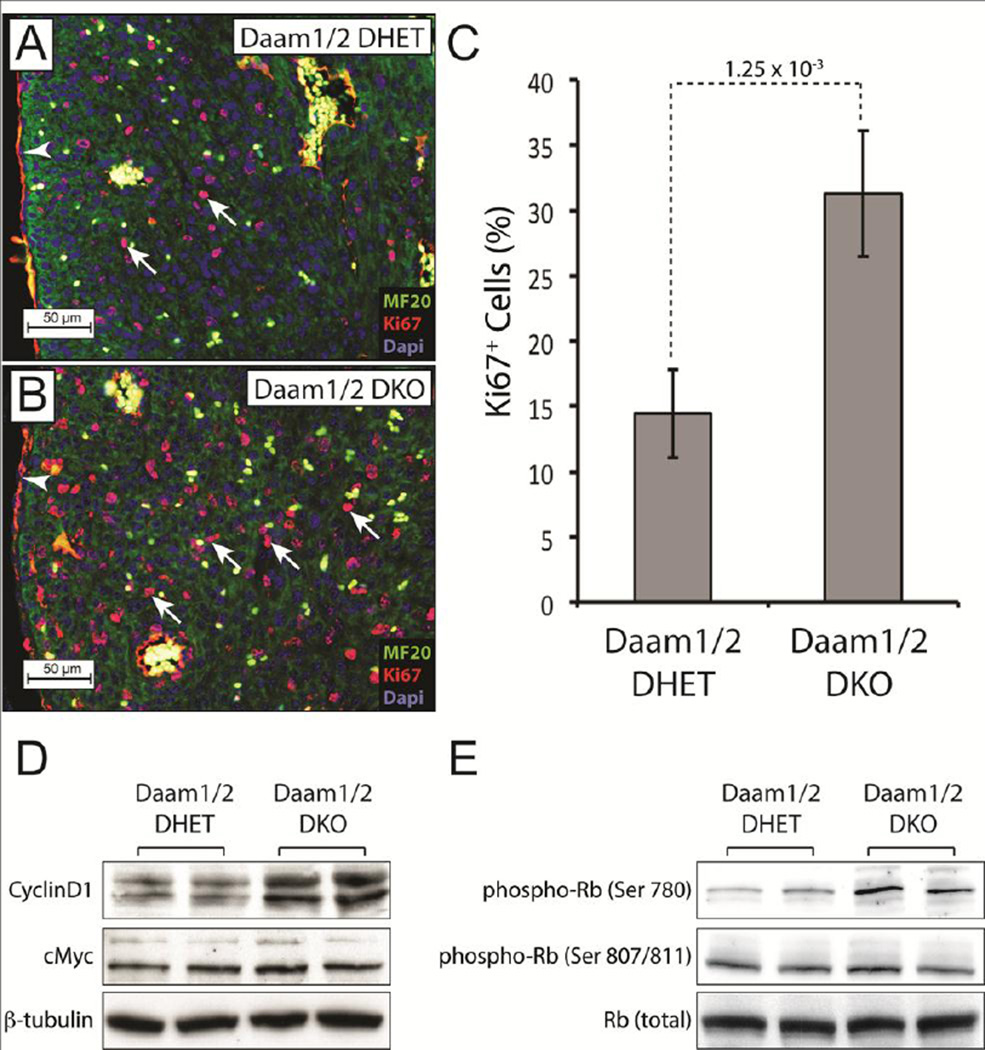
Figure 4.
Loss of DAAM1 and 2 increases cardiomyocyte proliferation. A,B Staining E17.5 Daam1/2 DKO and DHET hearts for the S-phase marker Ki67 (red), the muscle marker MF20 (green) and DAPI (blue) revealed more MF20+/Ki67+ cells (arrows) in Daam1/2 DKO hearts (B) relative to controls (A). Blood cells autofluoresce in the red and green channels and thus appear yellow. Red staining in epicardial and endothelial cells (arrowheads) is non-specific background. C Mean percentages of MF20+/Ki67+ cells in E17.5 Daam1 DKO and control hearts. Result of Student’s t-test is shown above the dotted line. D,E Western blots showing increased CyclinD1 (D) and phosphorylation of Retinoblastoma (Rb) at serine 780 (E) in E17.5 Daam1/2 DKO hearts relative to controls. The levels of cMYC, β-tubulin, total Rb and the phosphorylation of Rb at serine 807/811 were similar in Daam1/2 DHET and Daam1/2 DKO embryos.

