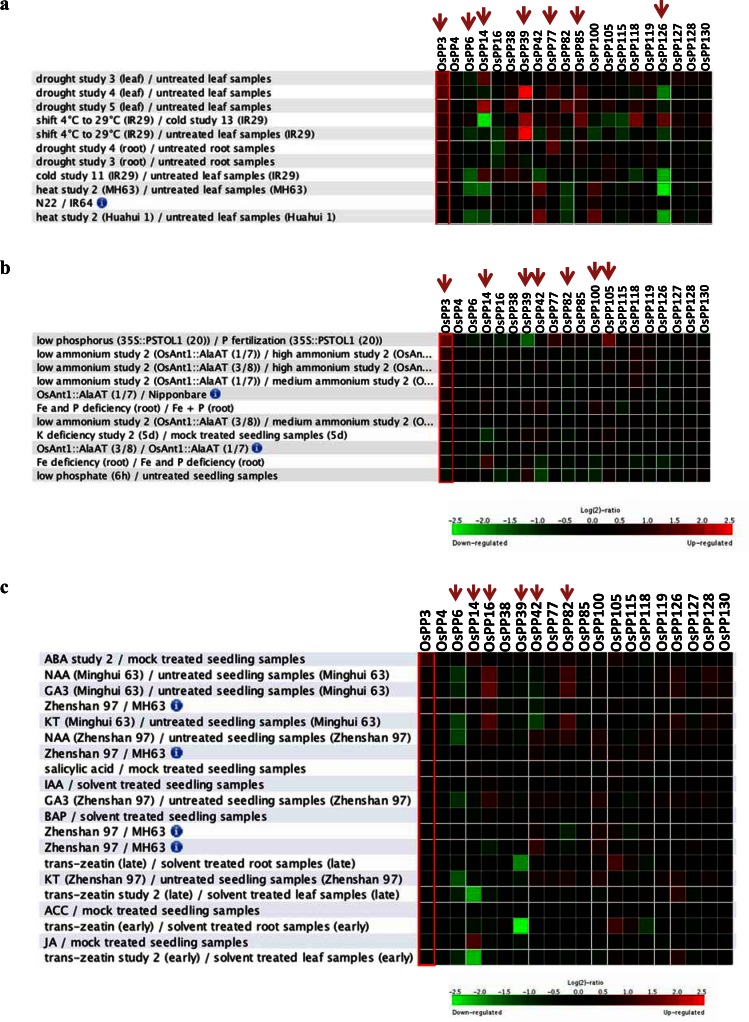
Fig. (2).
Expression profile of rice DSPs under abiotic stress (a), nutrition deficiency (b), and hormones (c). On the left side tissue types, conditions and treatment controls are mentioned. Gene names are listed on the top of heat map. Green color indicates the down regulation and red color is for up regulation of the transcript level of individual DSP genes. Expression profile of selected genes is shown on the basis of differential expression. Red arrow above the heat map indicates the genes, which are differentially expressed.

