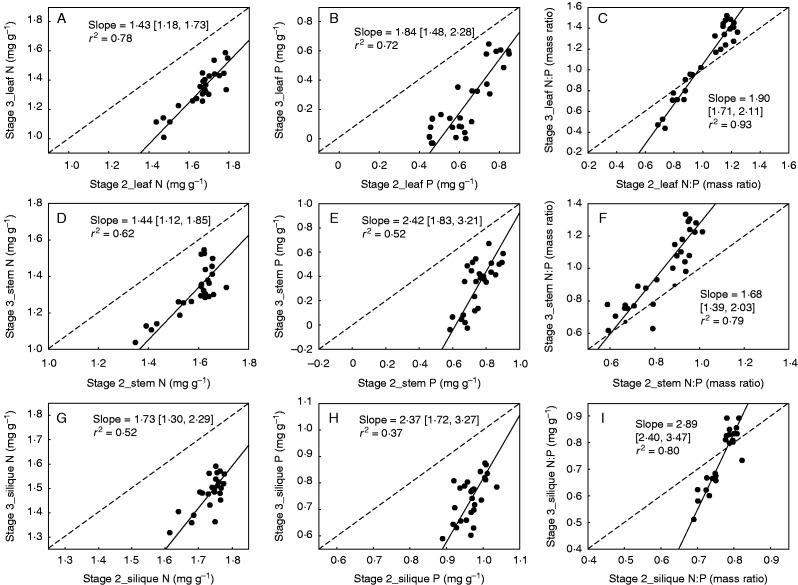
FIG. 3.
Scaling relationships of N and P concentrations and N : P ratios and across pairwise stage combinations within each organ. Reduced major axis (RMA) regression was used to determine the significant line (P < 0·05). Numbers in square brackets are the lower and upper 95 % confident intervals of the RMA slopes. All data were log10-transformed before analysis.

