Fig. 6.
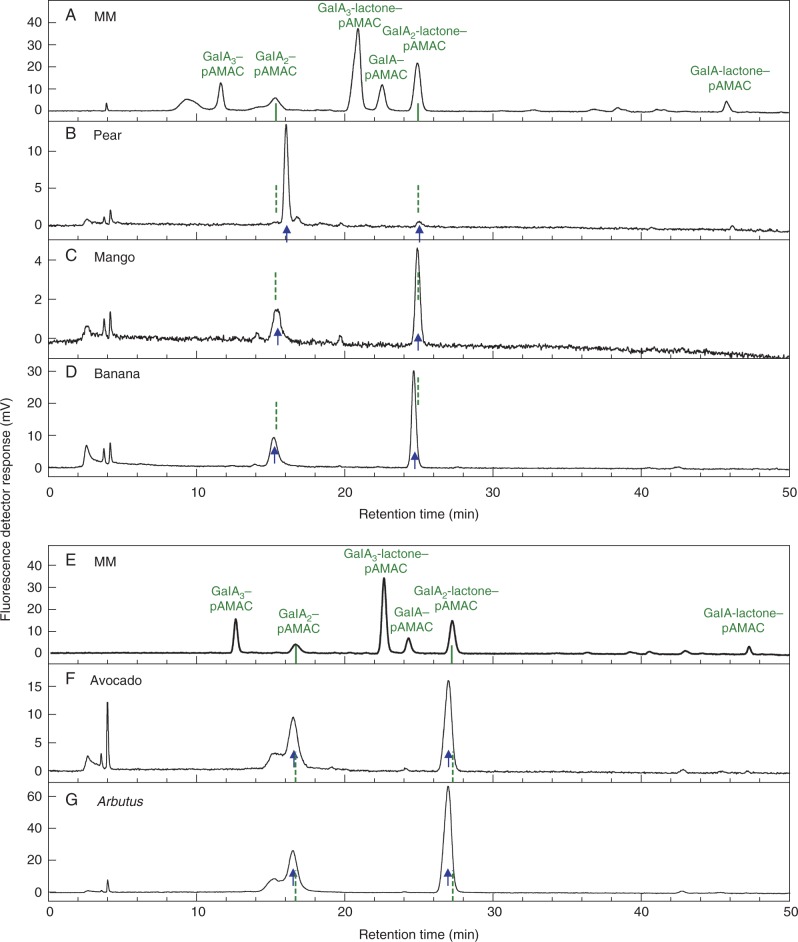
HPLC of the acidic dimer (2AF) spots from Driselase-digested pAMAC-labelled cell walls of five fruit species. 2AF spots were eluted from a paper electrophoretogram (similar to that shown in Fig. 3 but derived from non-de-lactonized samples; all three ripening stages combined) and analysed by HPLC. MM, marker mixture containing authentic acidic sugar–pAMAC conjugates. Arrows, the proposed fingerprints for •OH attack: pAMAC·UA-GalA and its lactone (rapidly re-formed during elution from the electrophoretogram) from fruit cell wall digests. Dashed lines, predicted position of authentic GalA2–pAMAC and GalA2-lactone–pAMAC, deduced from the marker run. The samples in the upper and lower graphs were run on different days, accounting for the slight discrepancy in marker retention times. Strawberry and apple were not included because they did not show any appreciable 2AF spot in Fig. 3.

